Create Infographics in Seconds with AI-Powered Layout Templates
Experience the magic of AI-powered infographic creation. Simply enter your content, select a template, and watch your vision come to life.
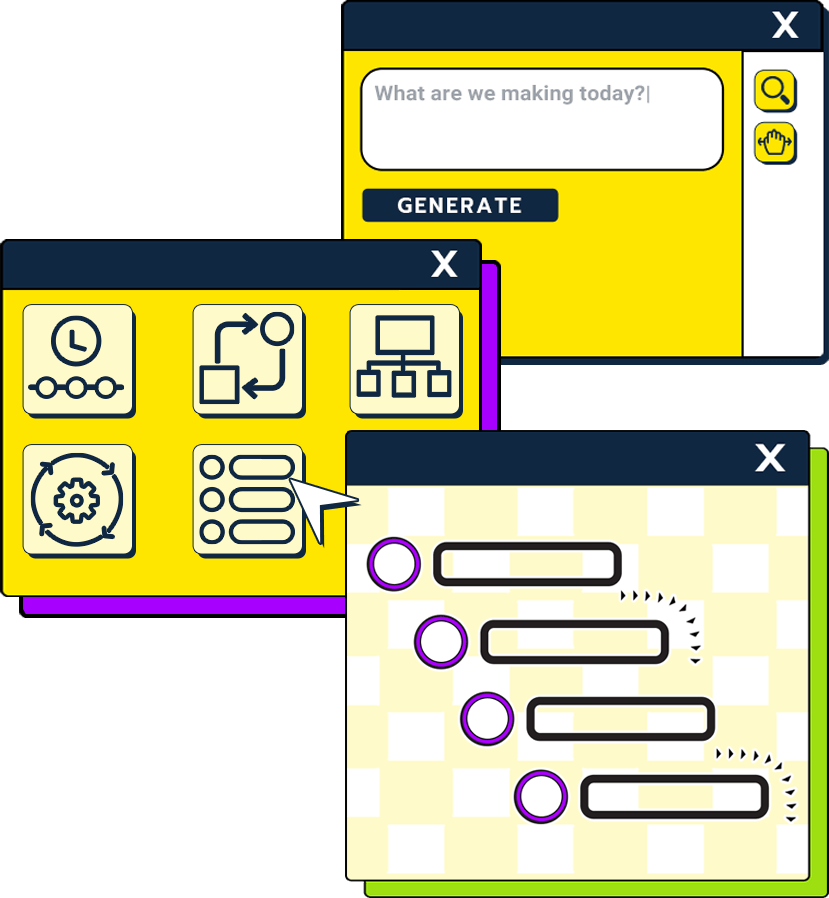
Experience the magic of AI-powered infographic creation. Simply enter your content, select a template, and watch your vision come to life.

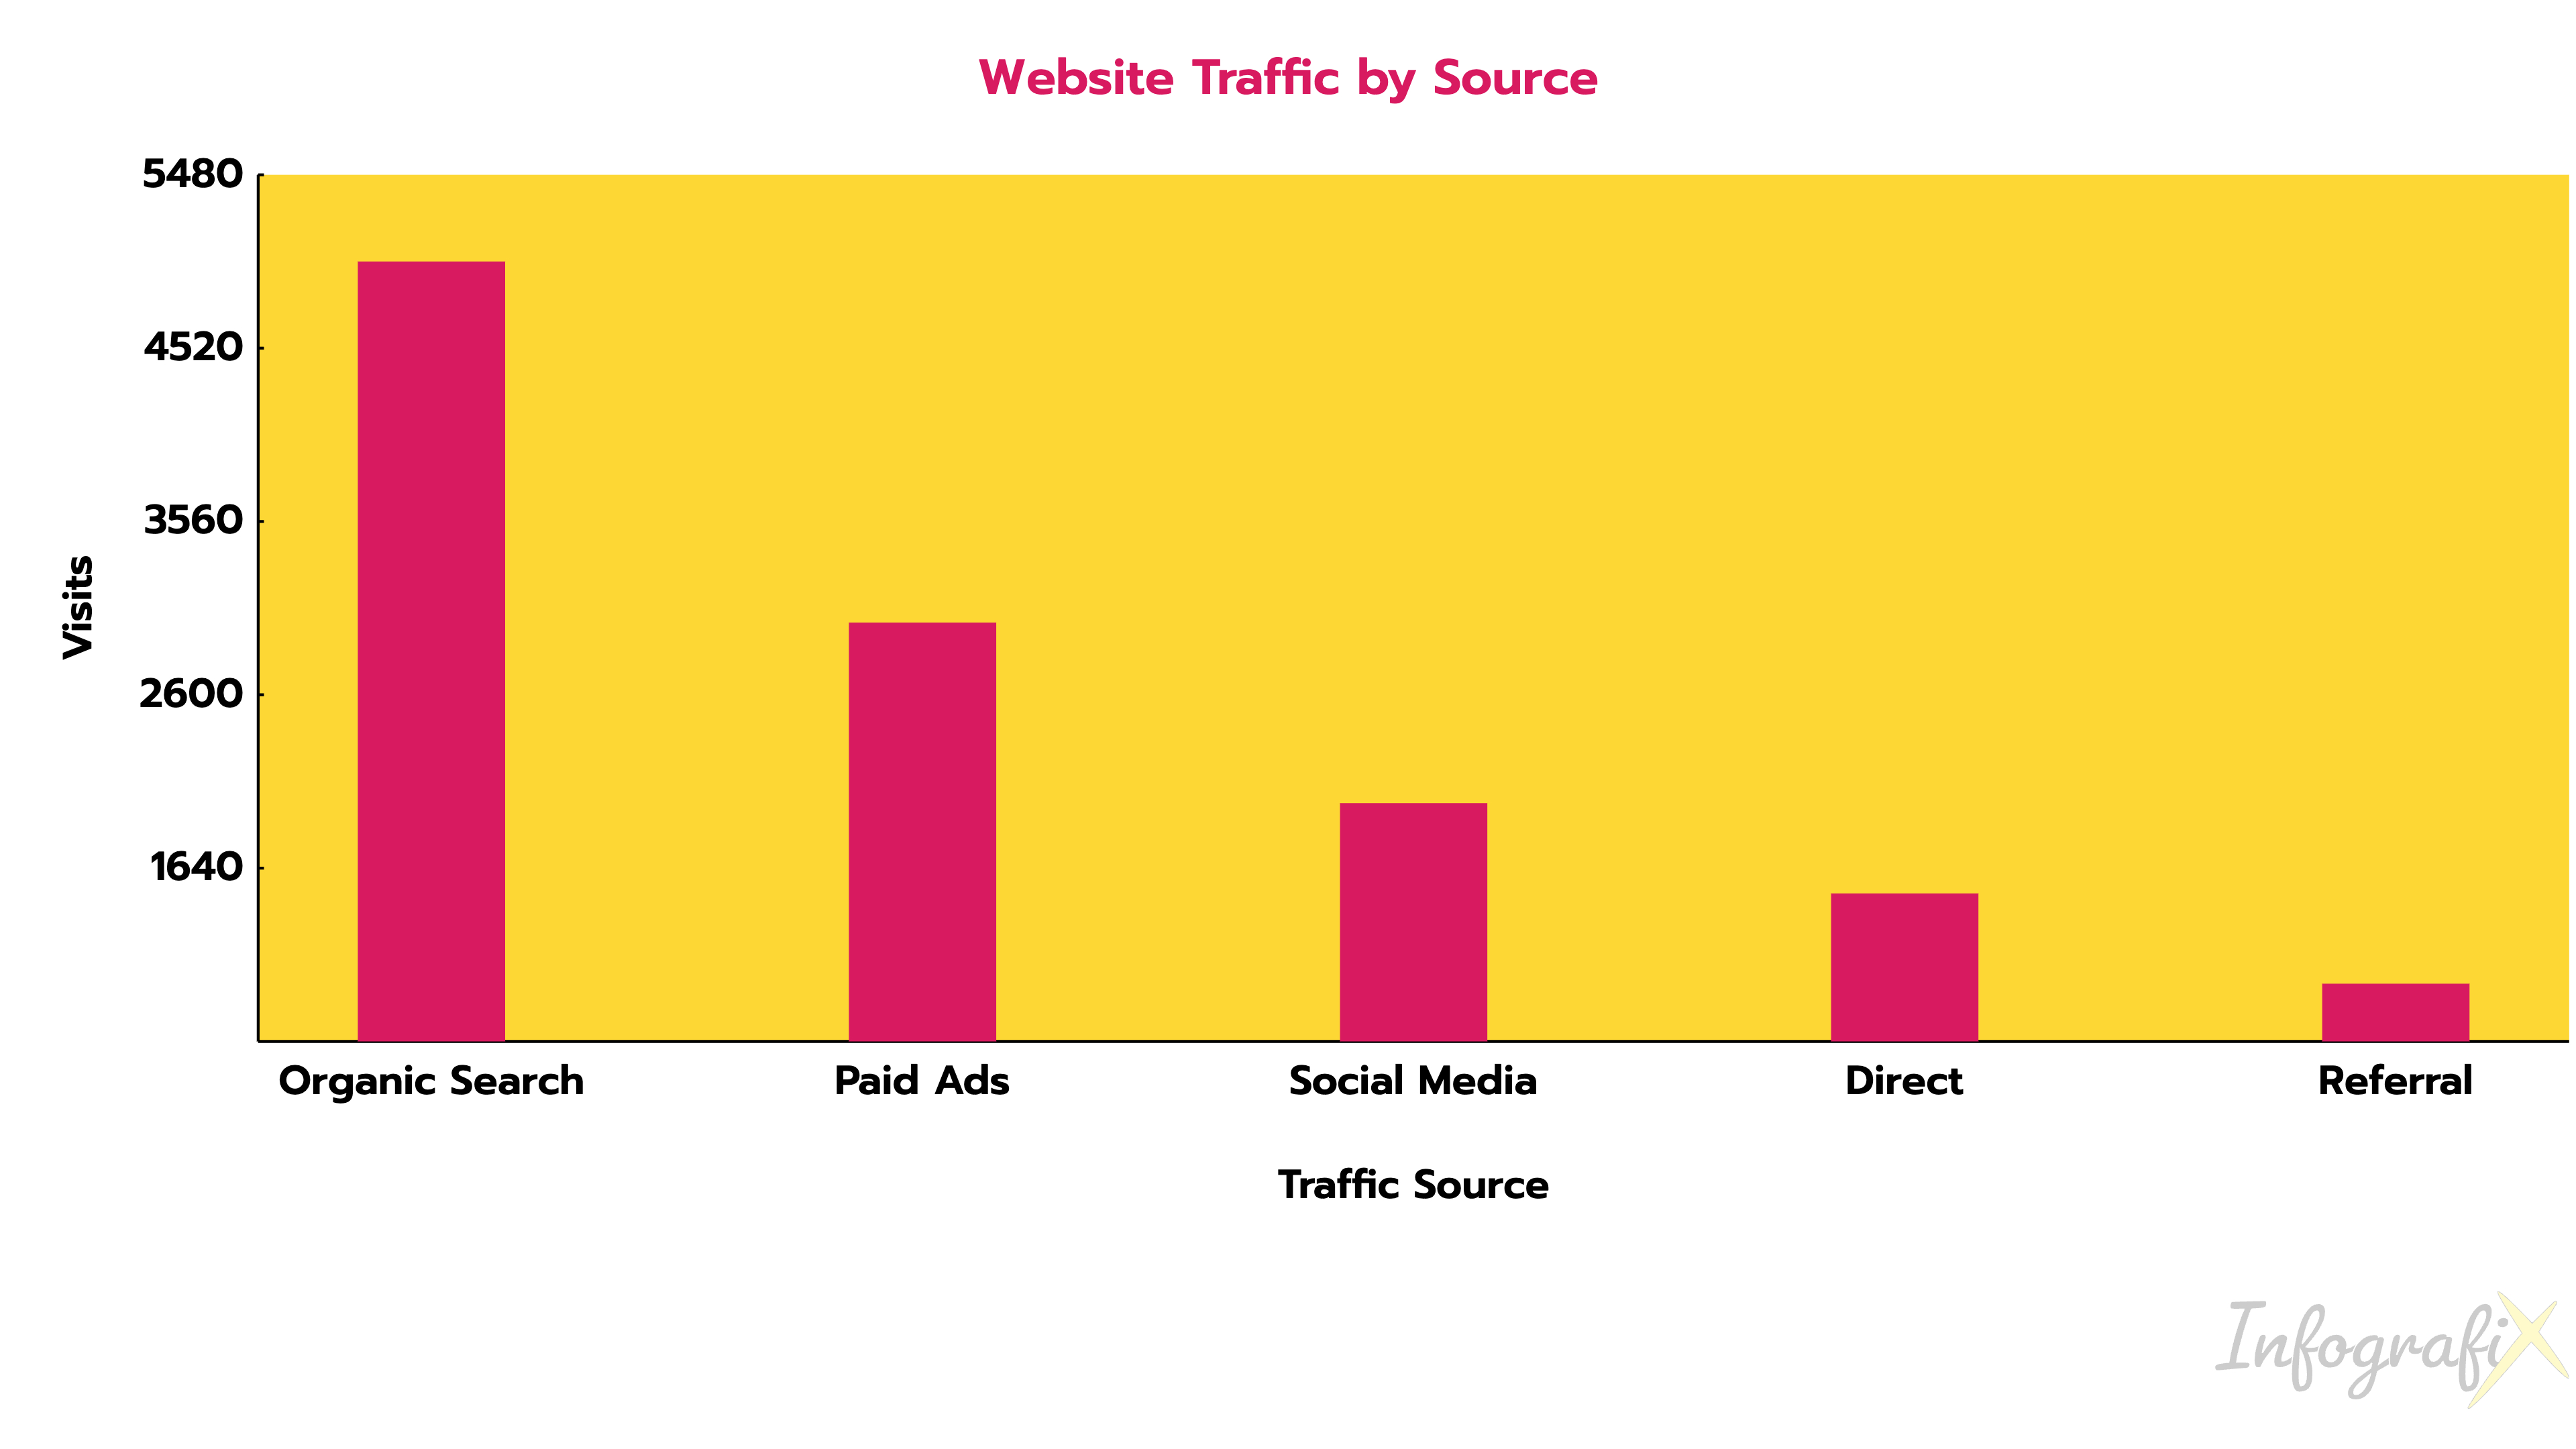
Bar charts are ideal for representing data that is divided into categories or groups.
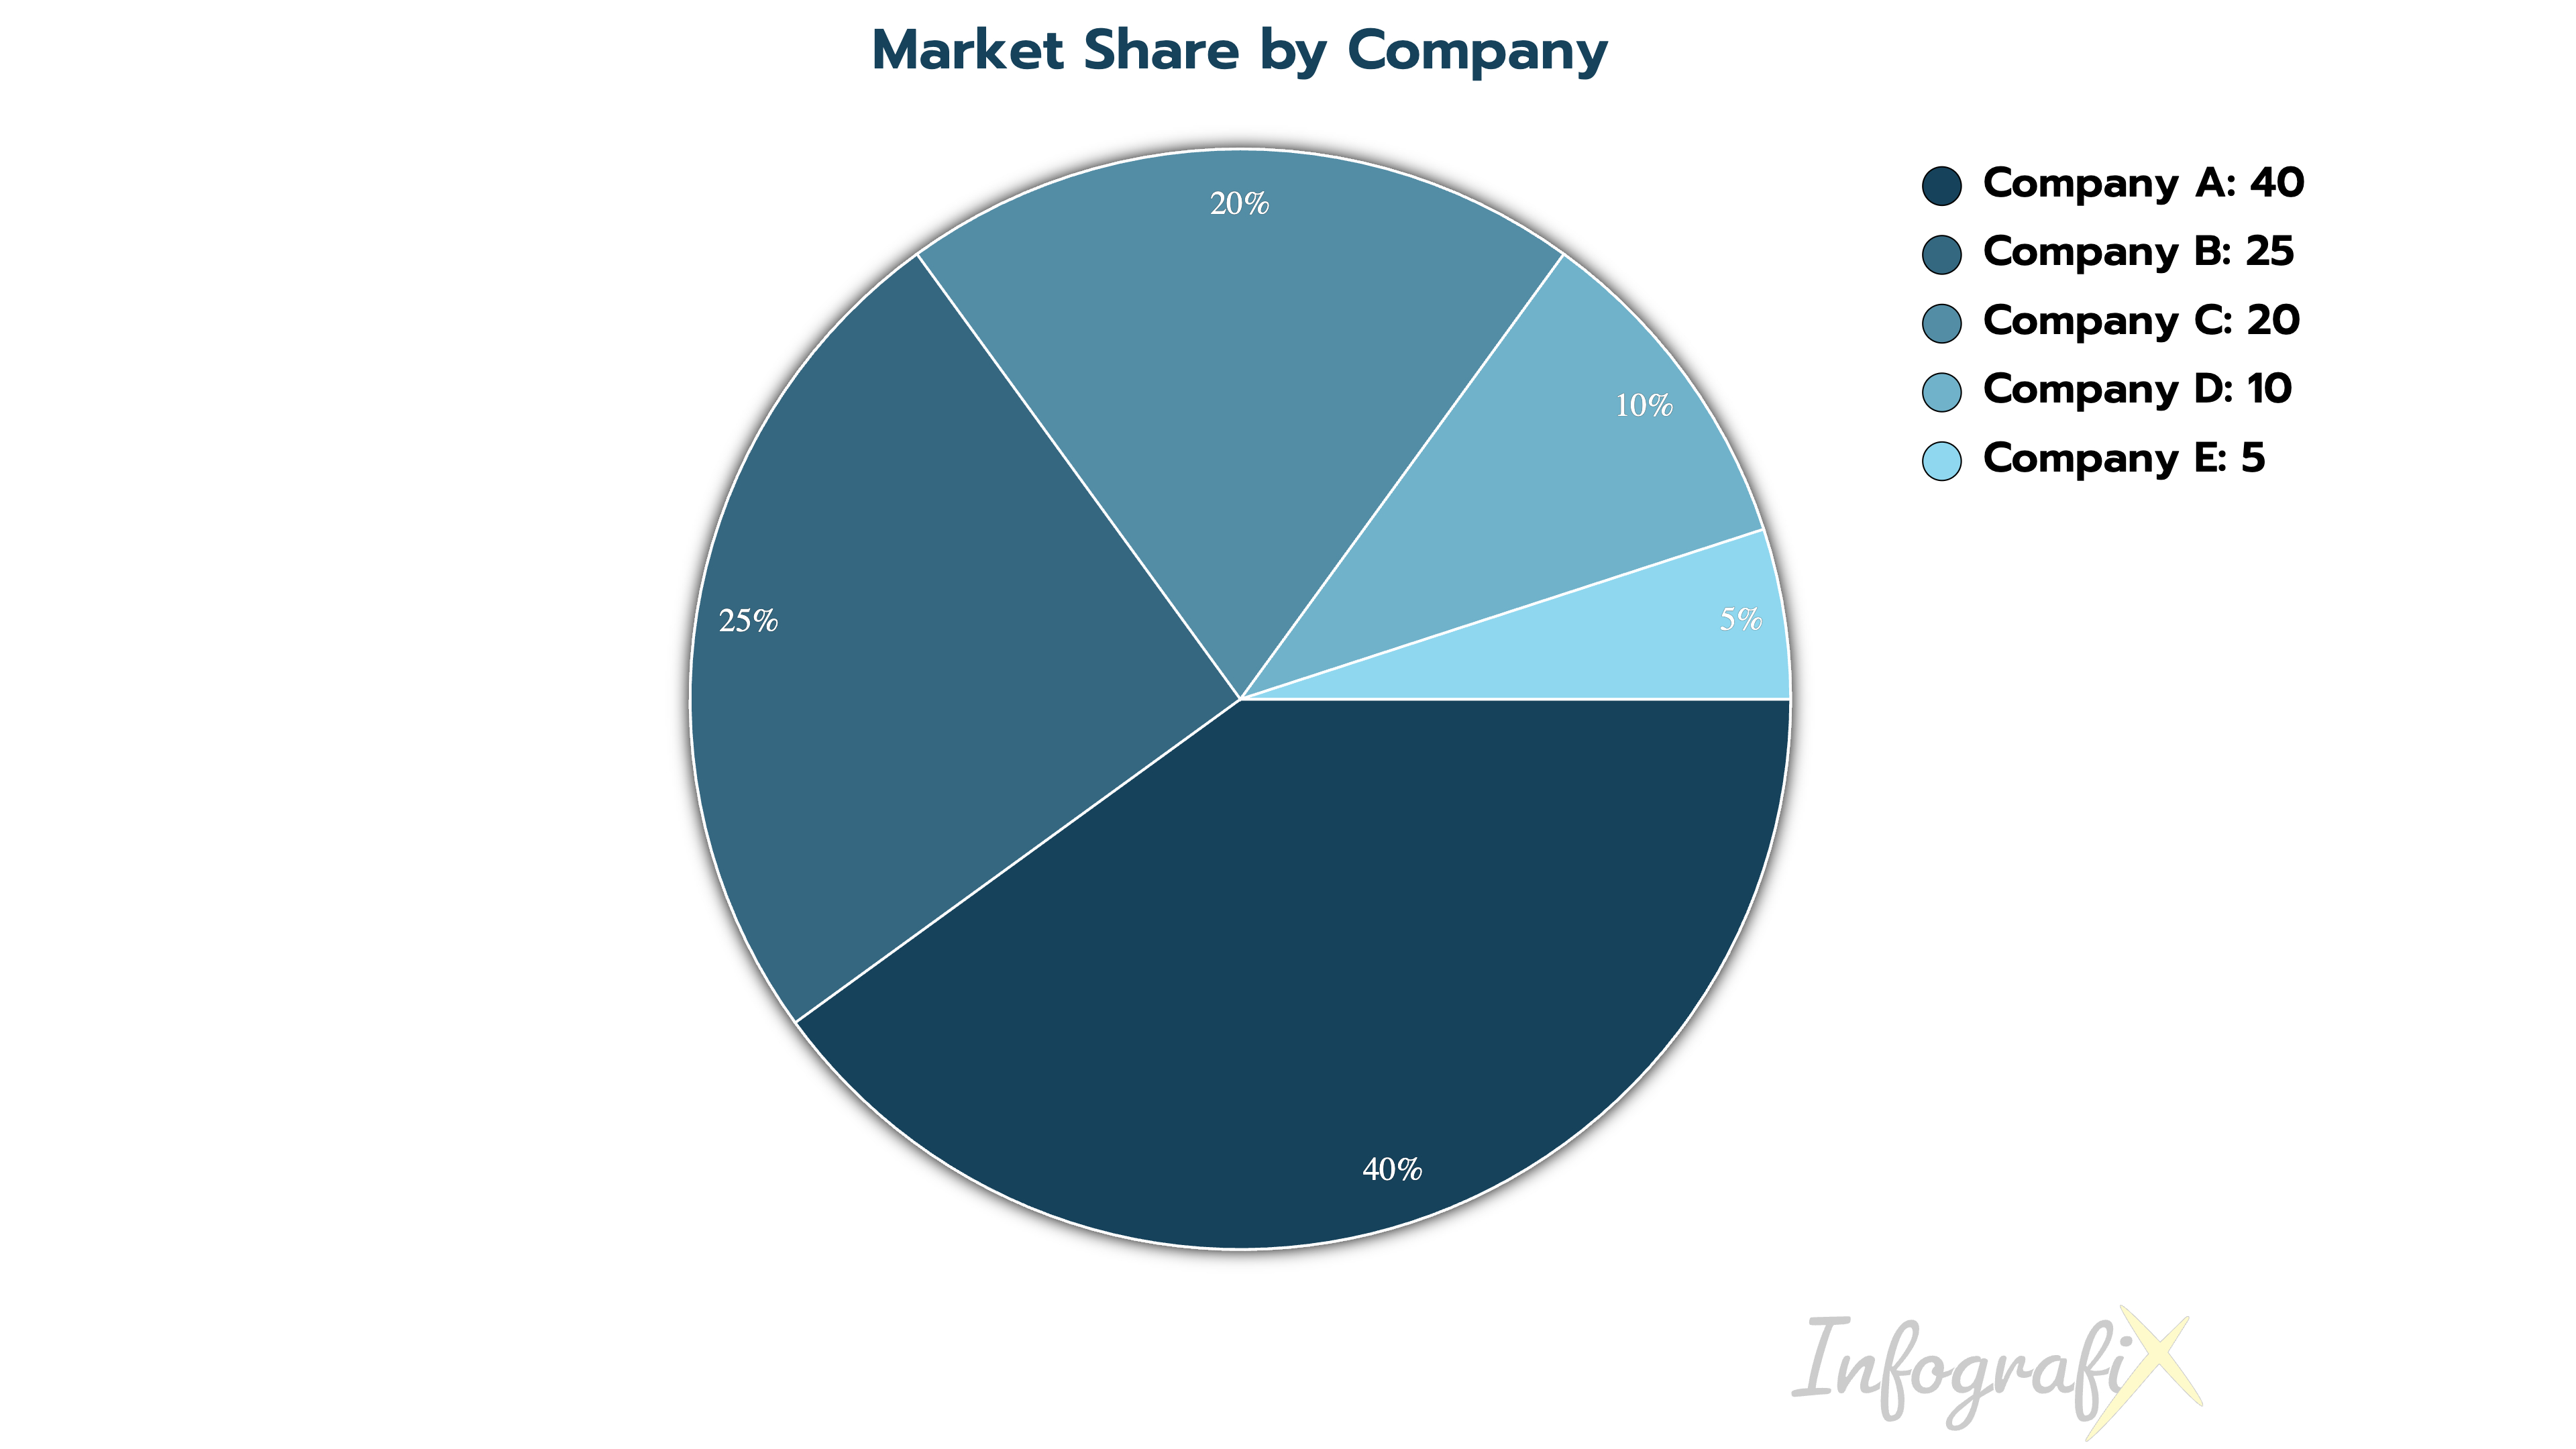
Pie Charts offer a visually appealing and easy-to-understand way to represent proportions of different categories.
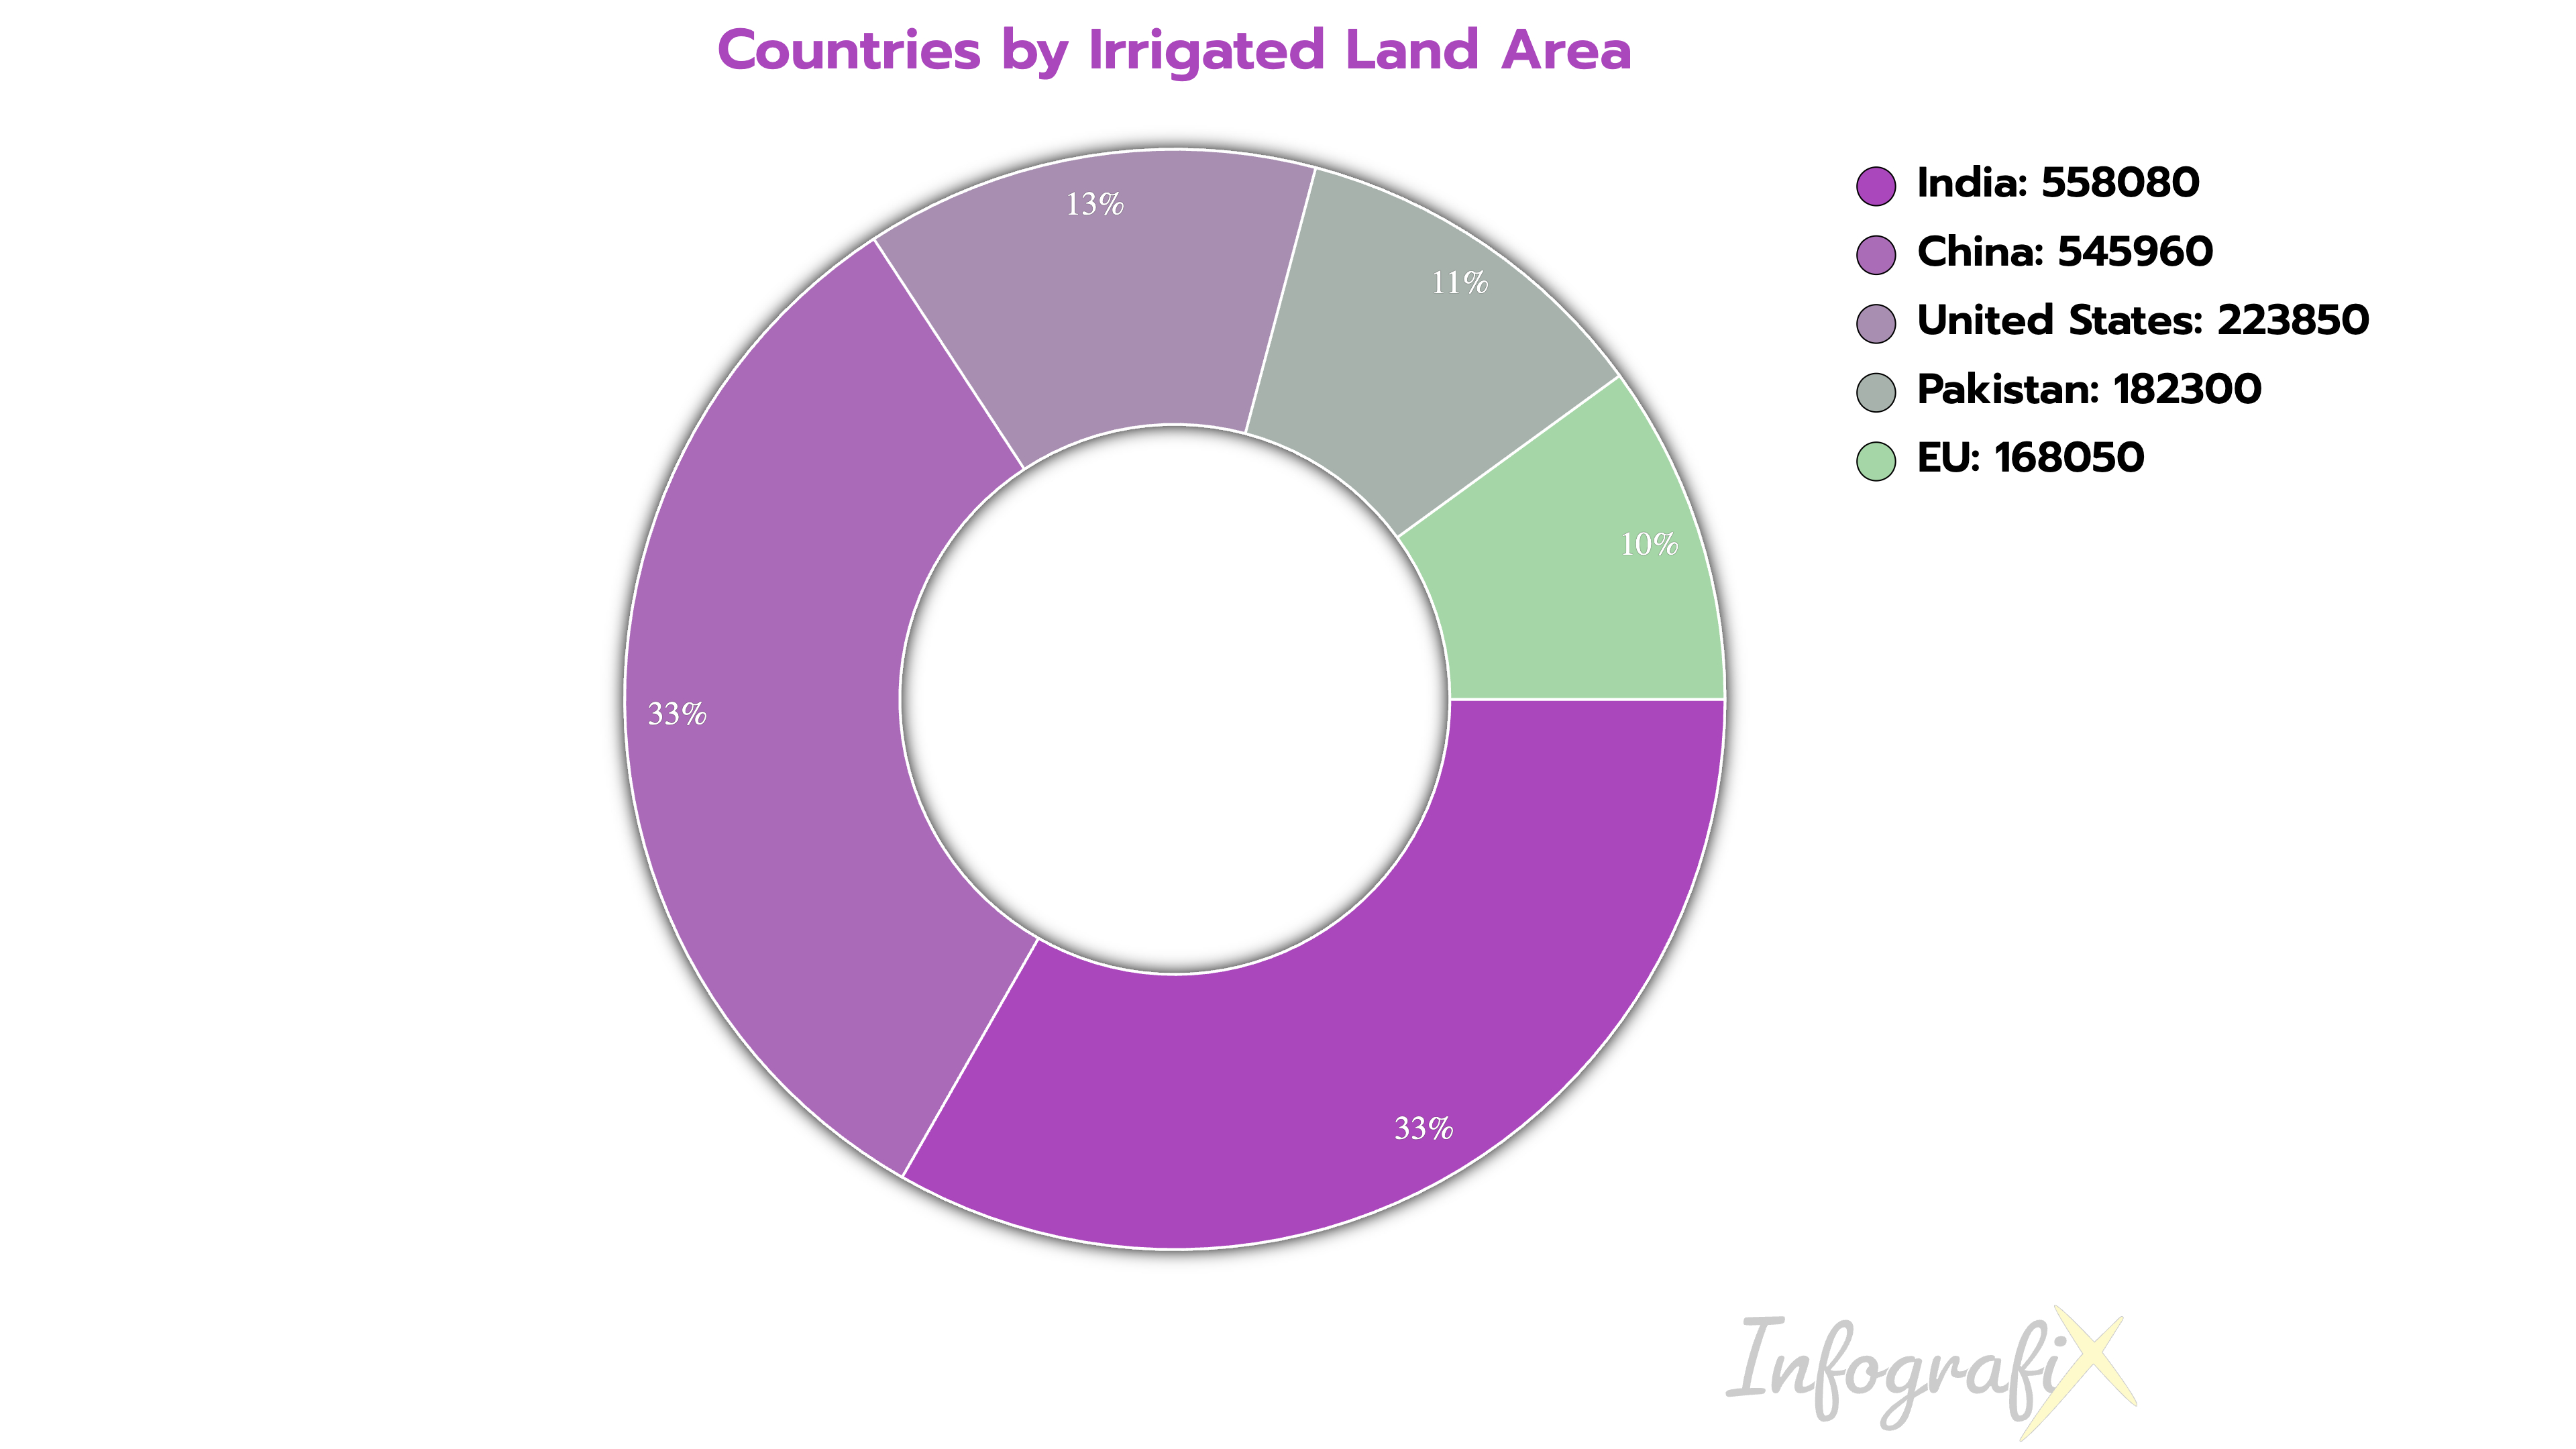
Donut Charts are alternative to pie charts. They're perfect for highlighting the largest category or showing a percentage breakdown.
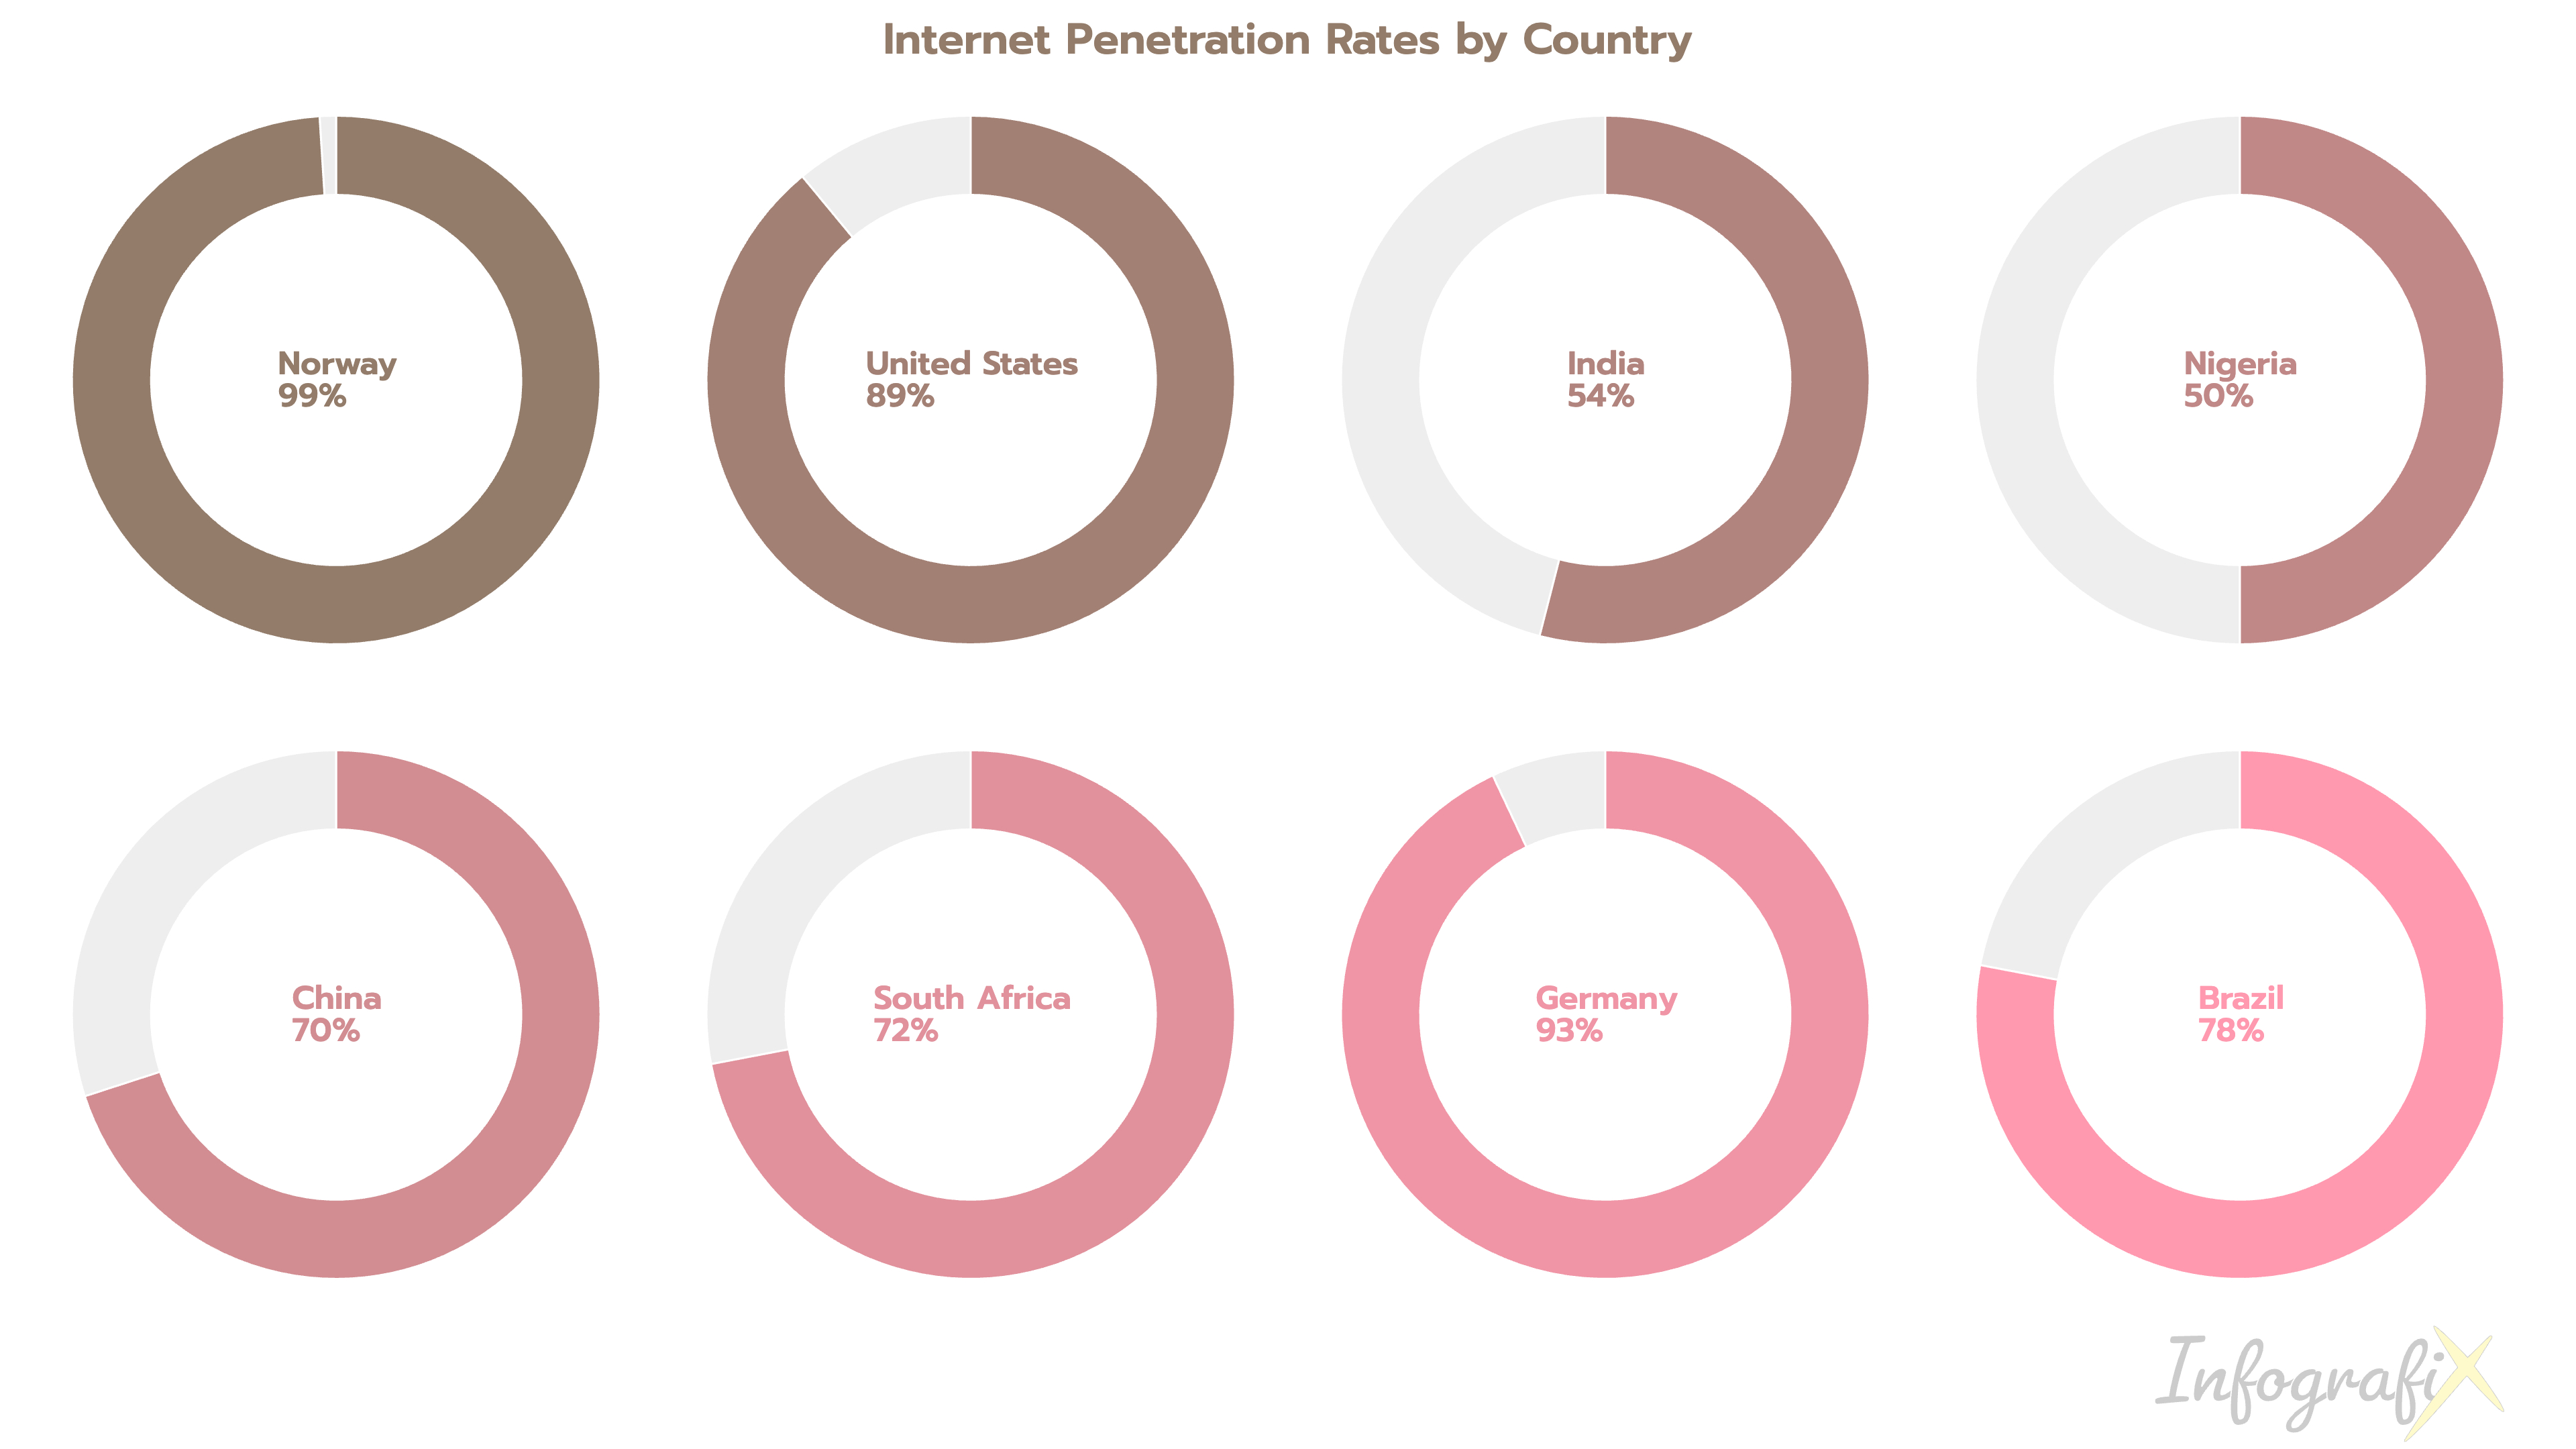
Knob Charts are great for showcasing a single value or metric through dashboards and presentations.

Line Charts easily see trends, patterns, and changes over time. Line charts are fantastic for showing growth, decline, or fluctuations in data.
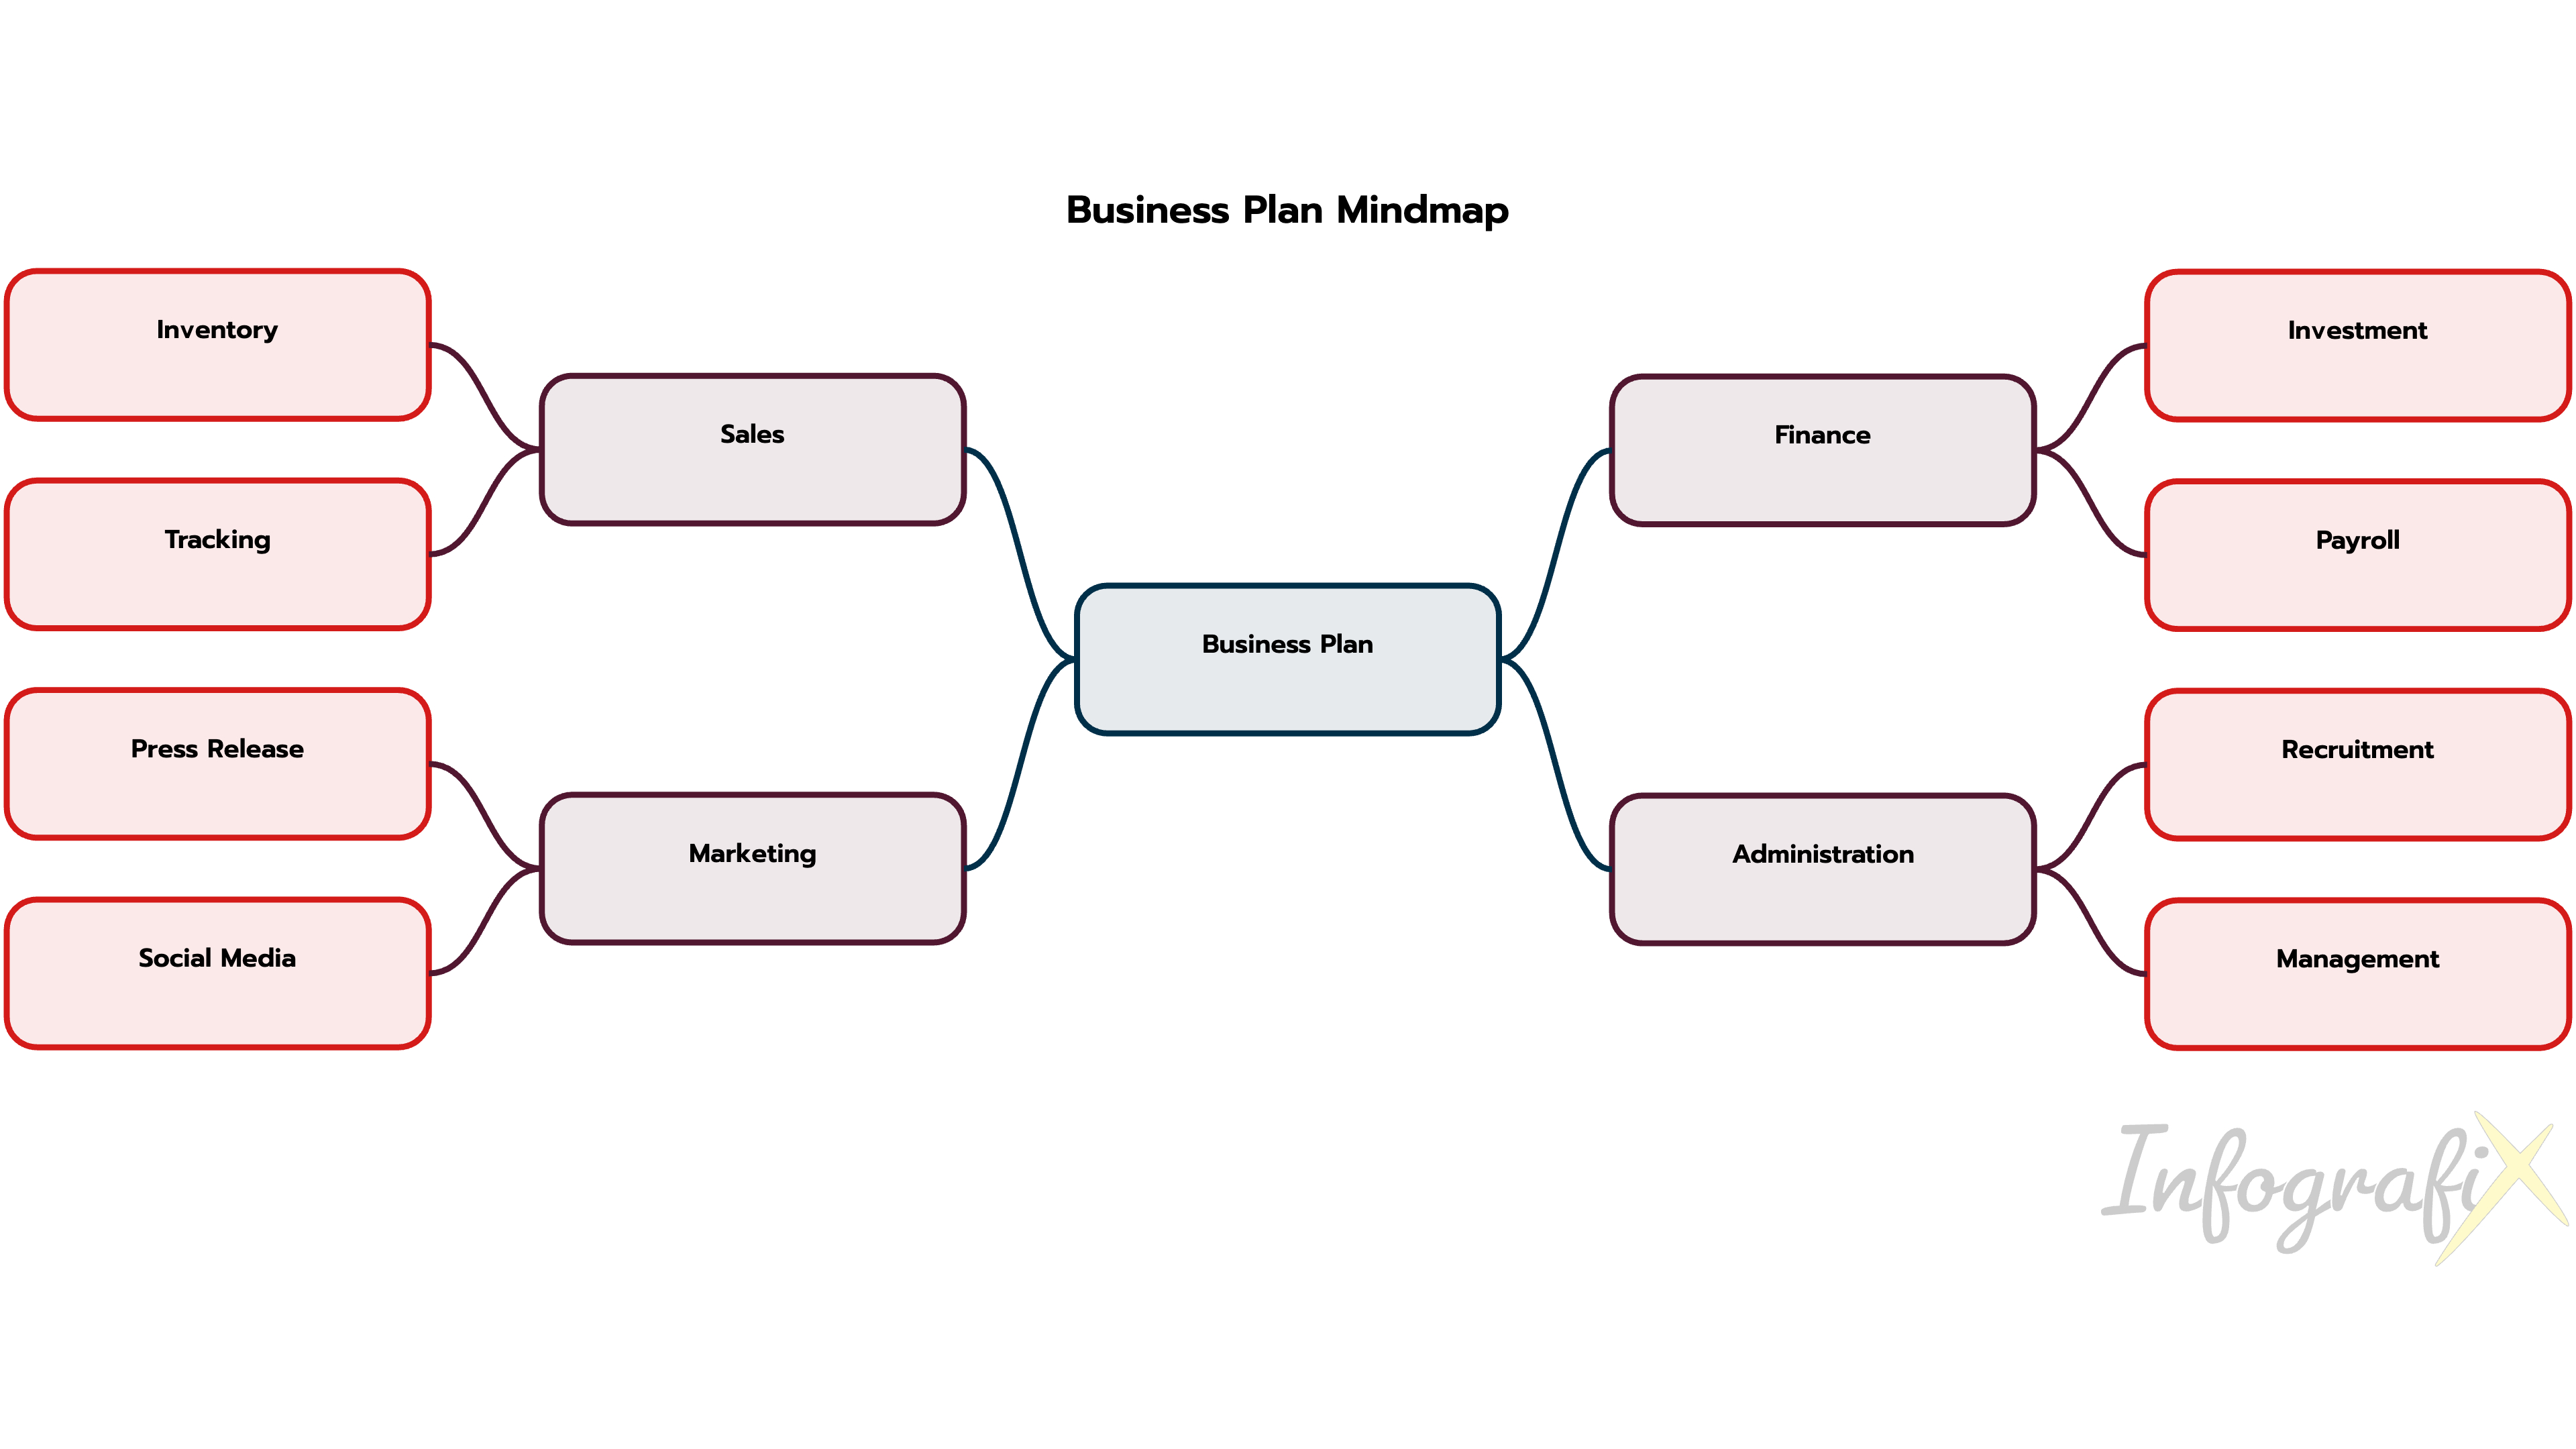
Mind Maps are powerful tool for connecting ideas and exploring different perspectives. They're perfect for everything from project planning to note-taking.
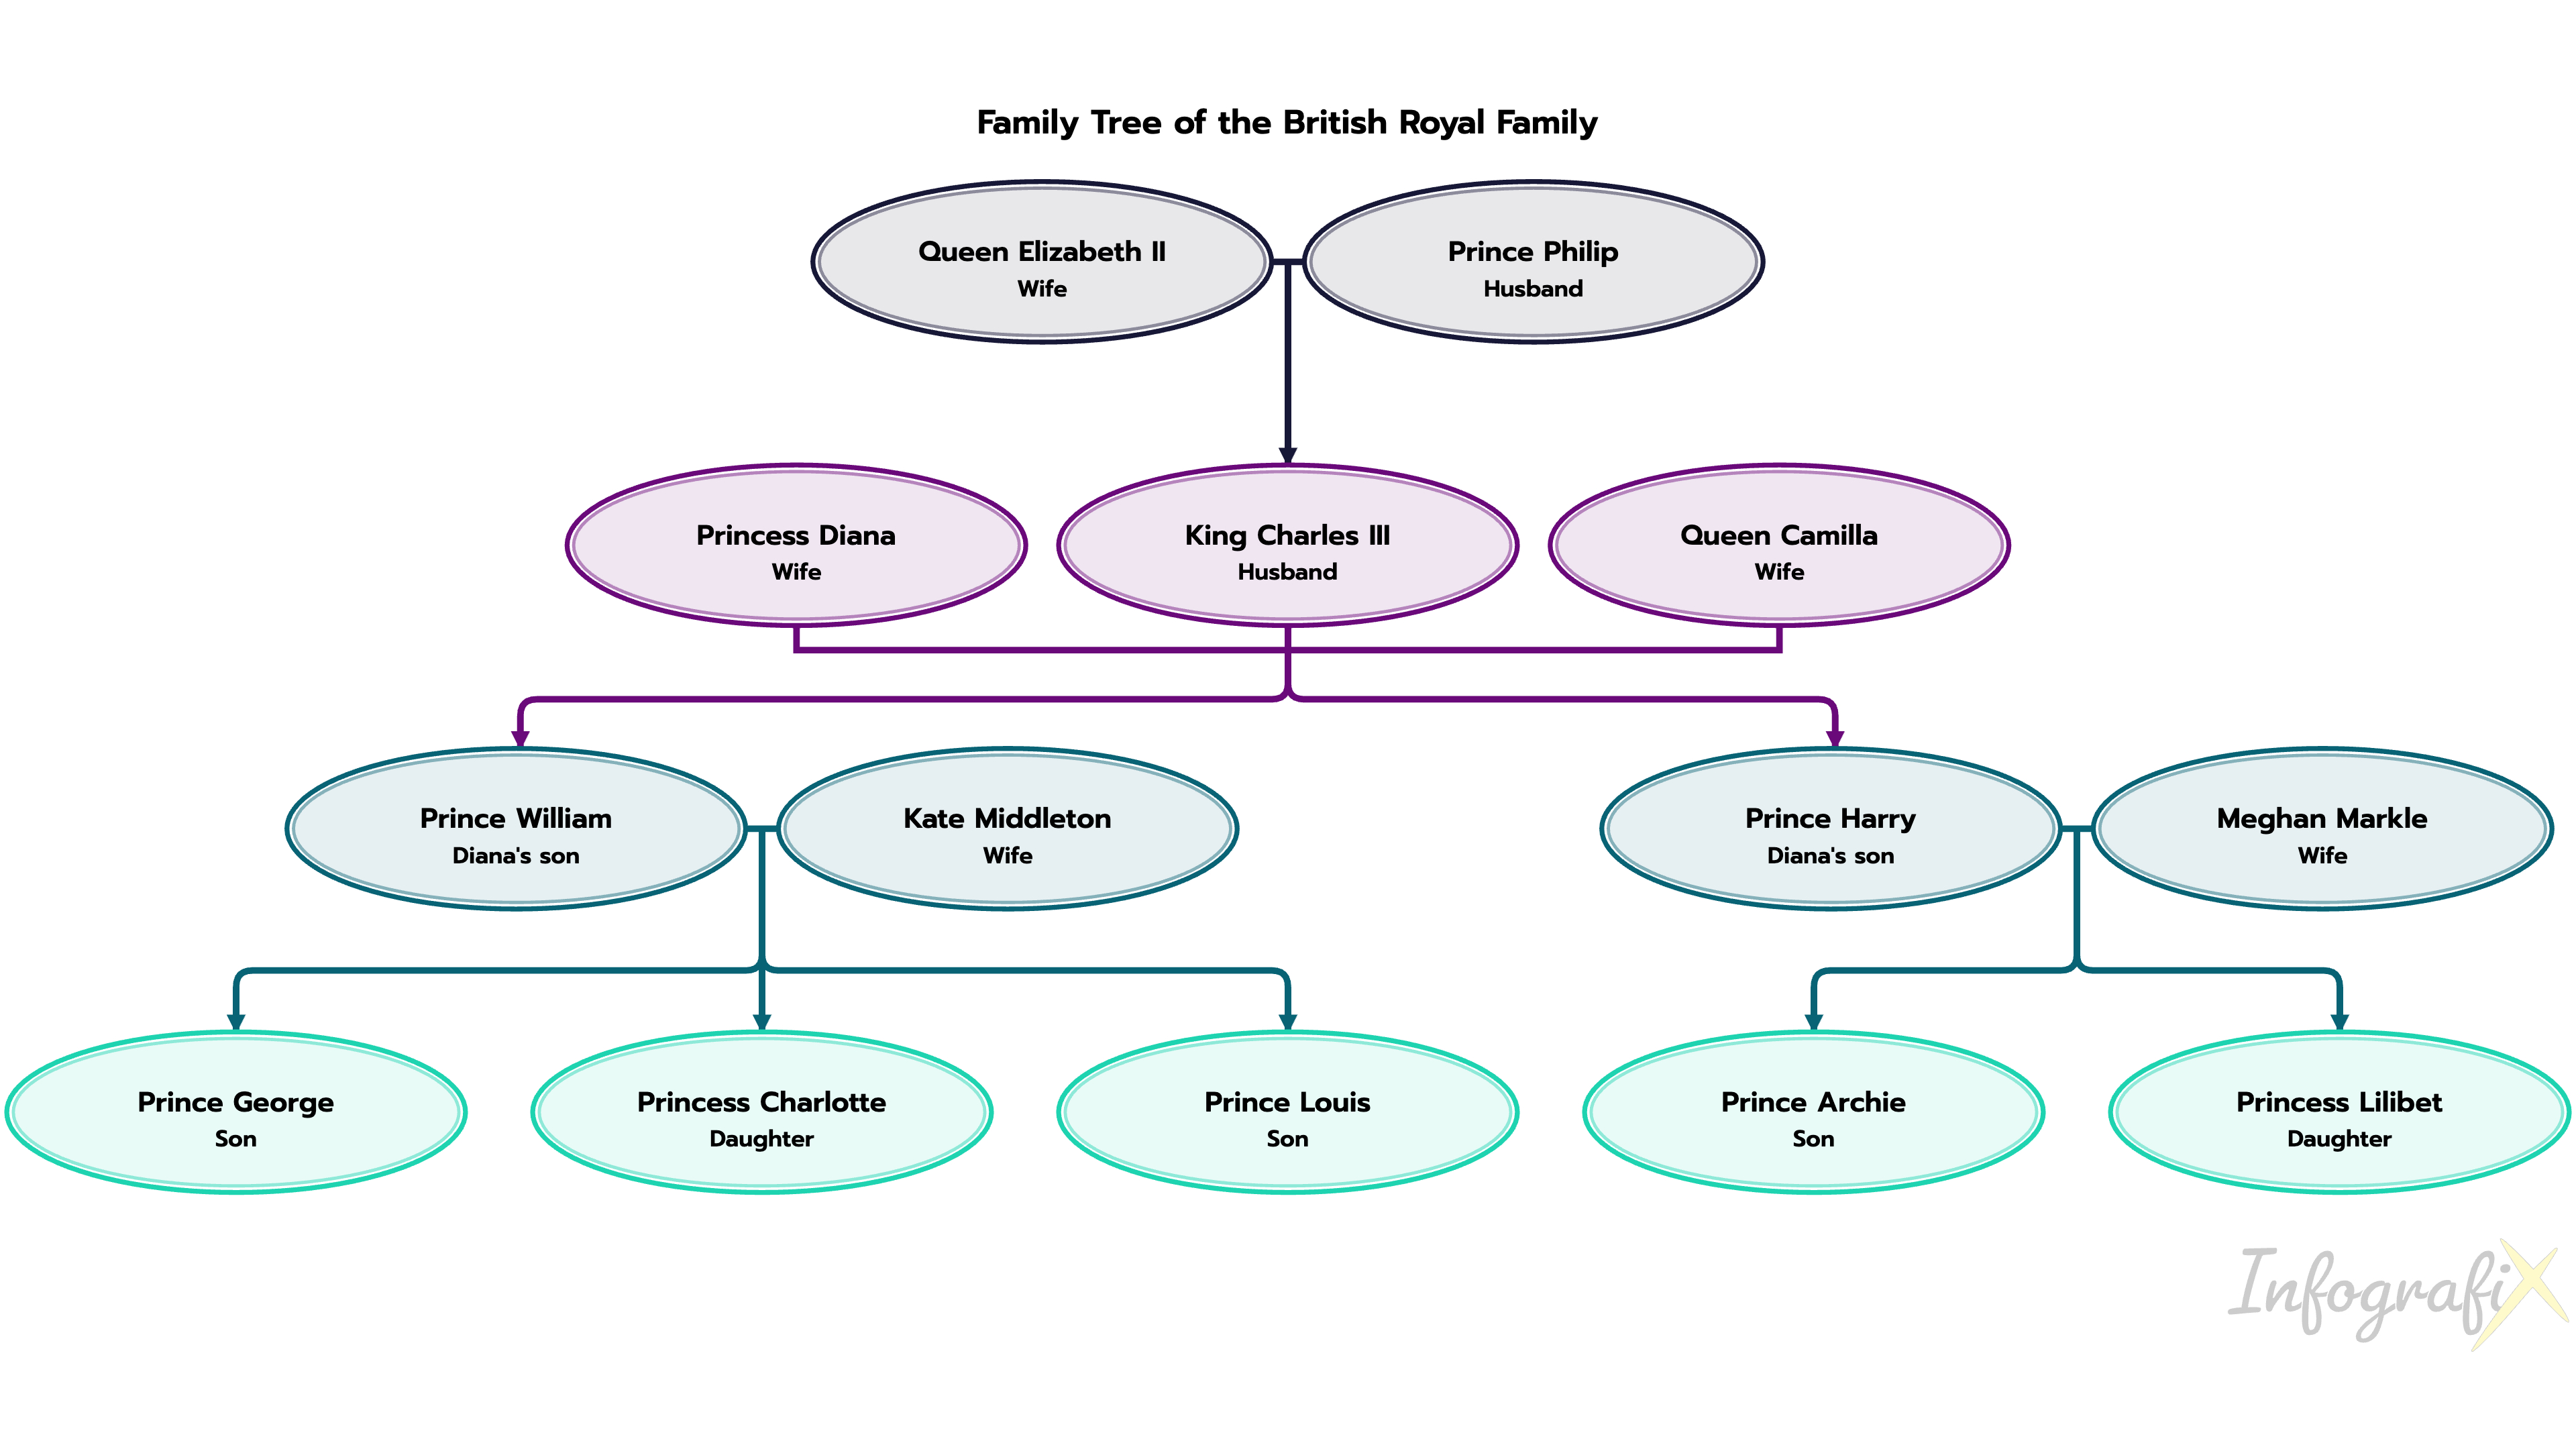
Family Trees are a wonderful way to trace lineage, learn about family history to connect with loved ones.
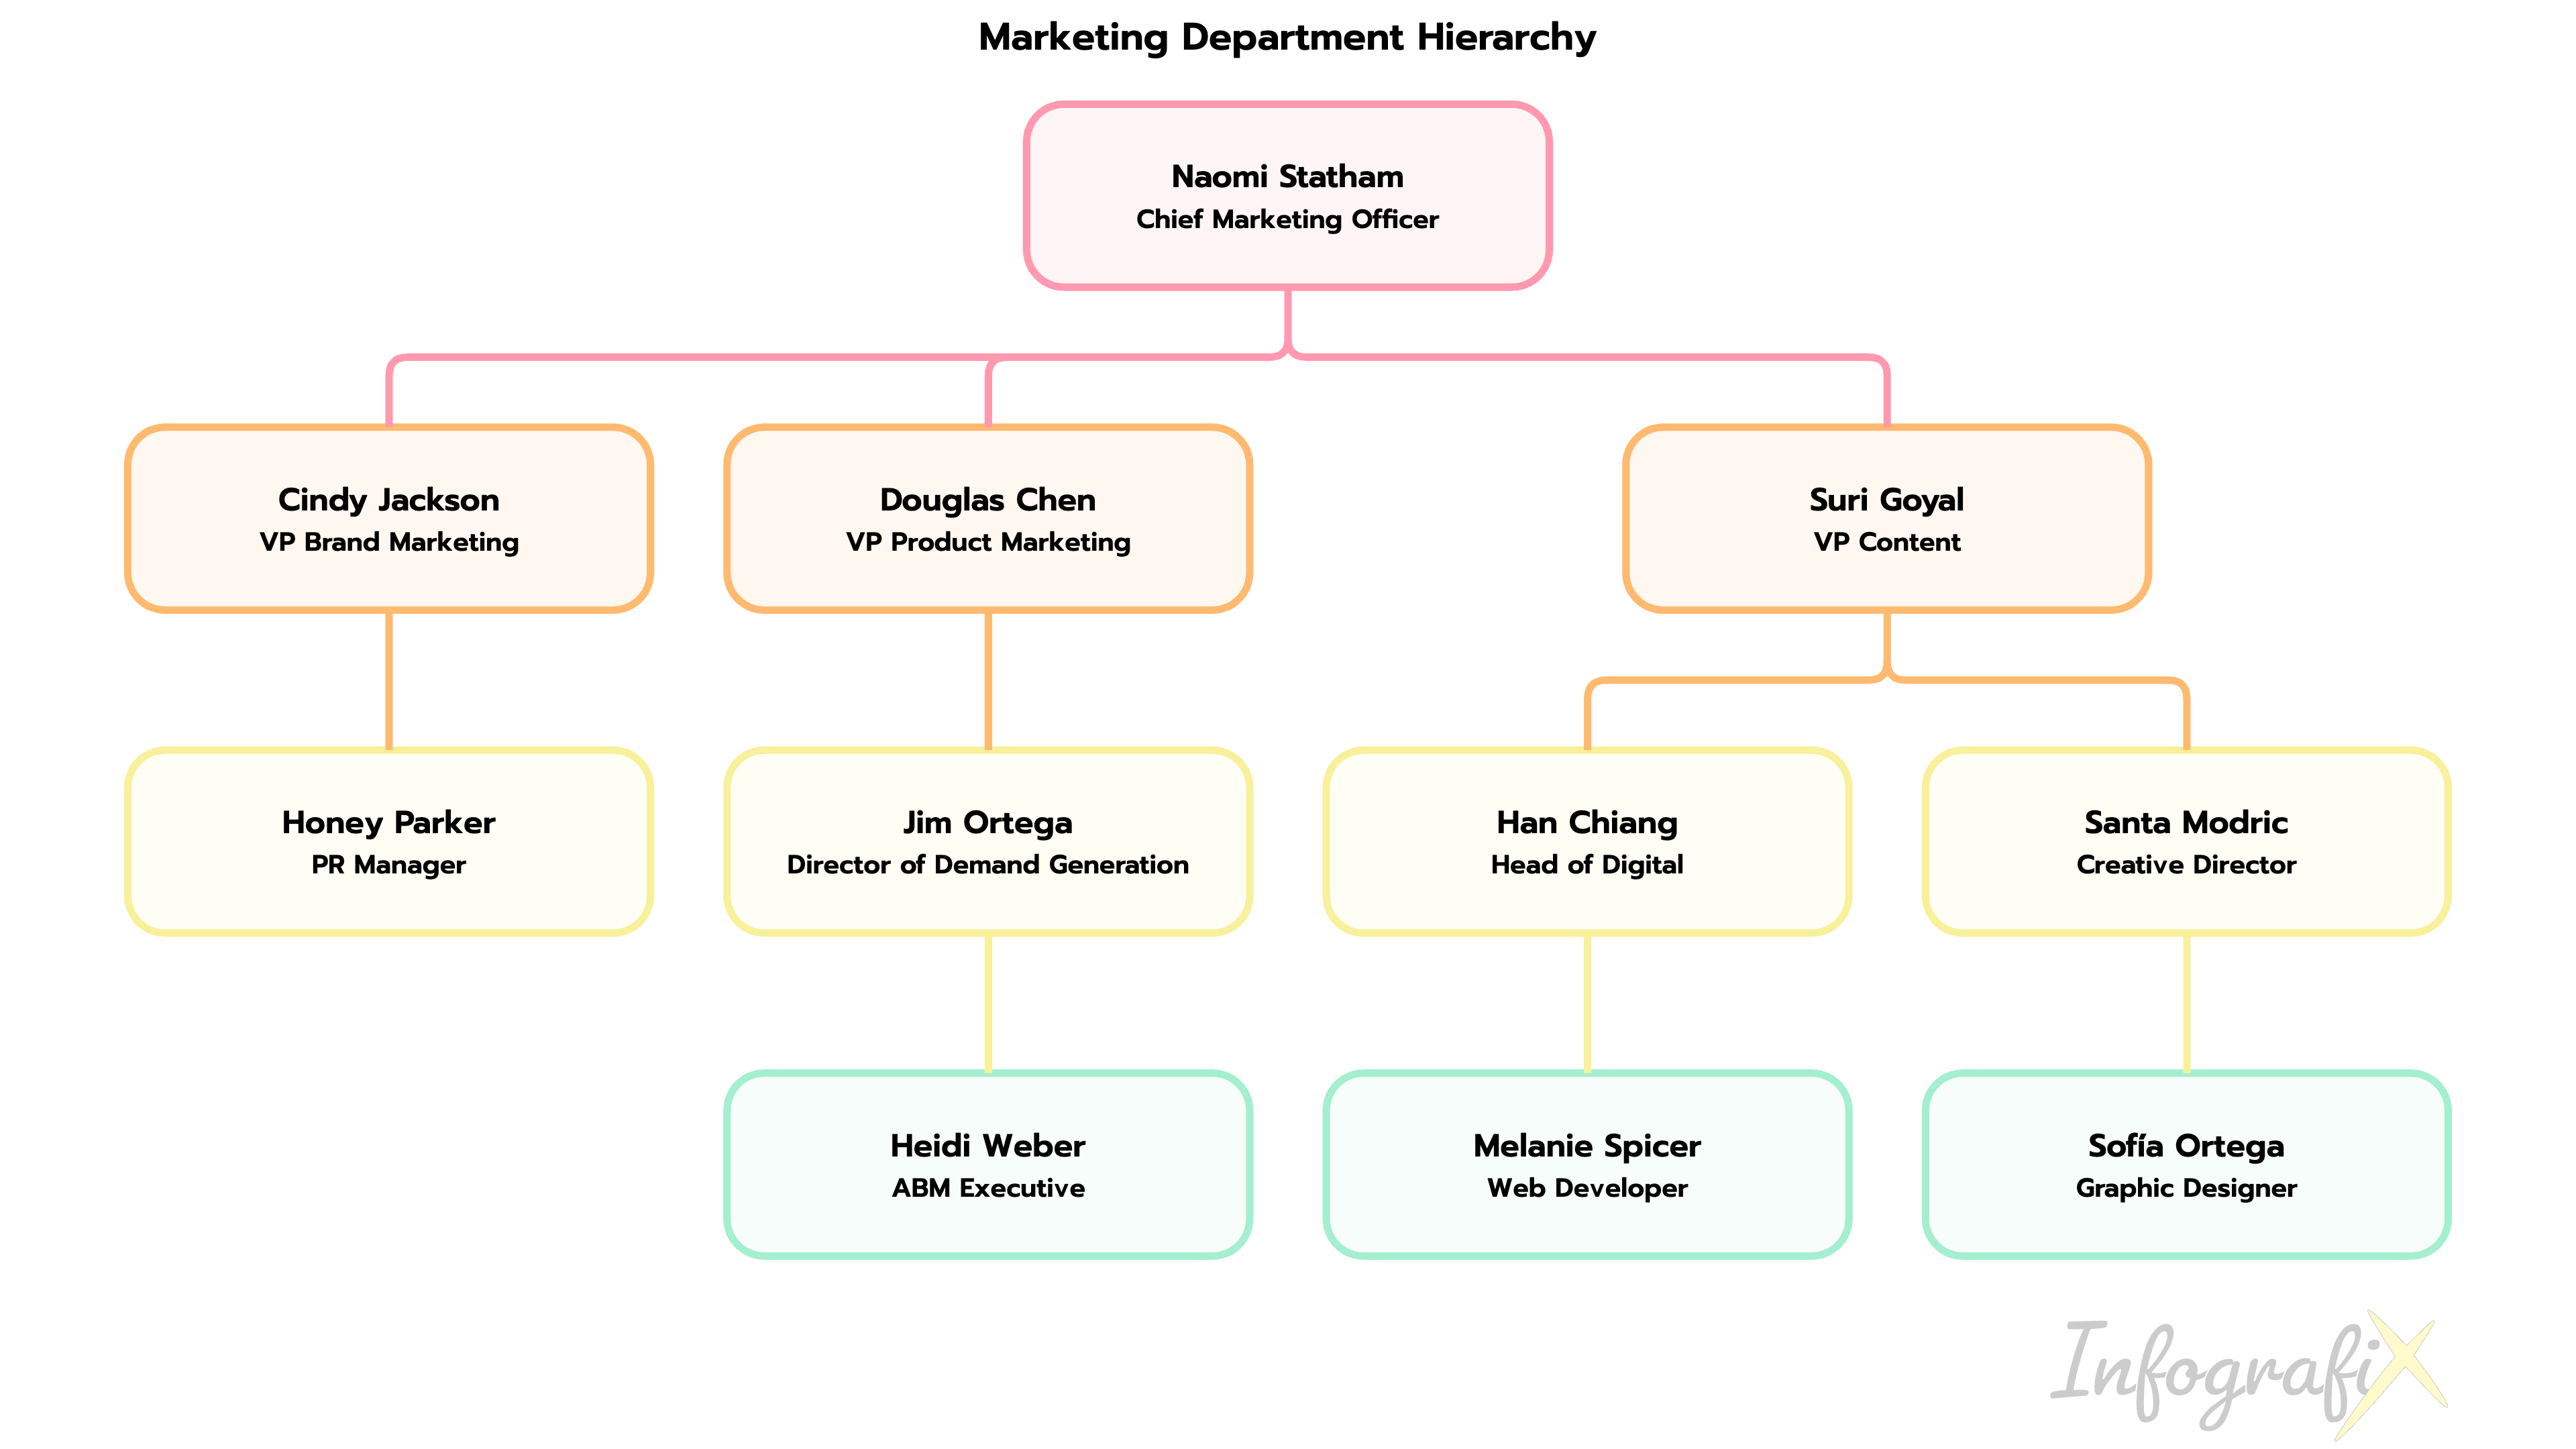
Hierarchies are a common way to organize information and understand how different elements relate to each other. From company structures to biological classifications.
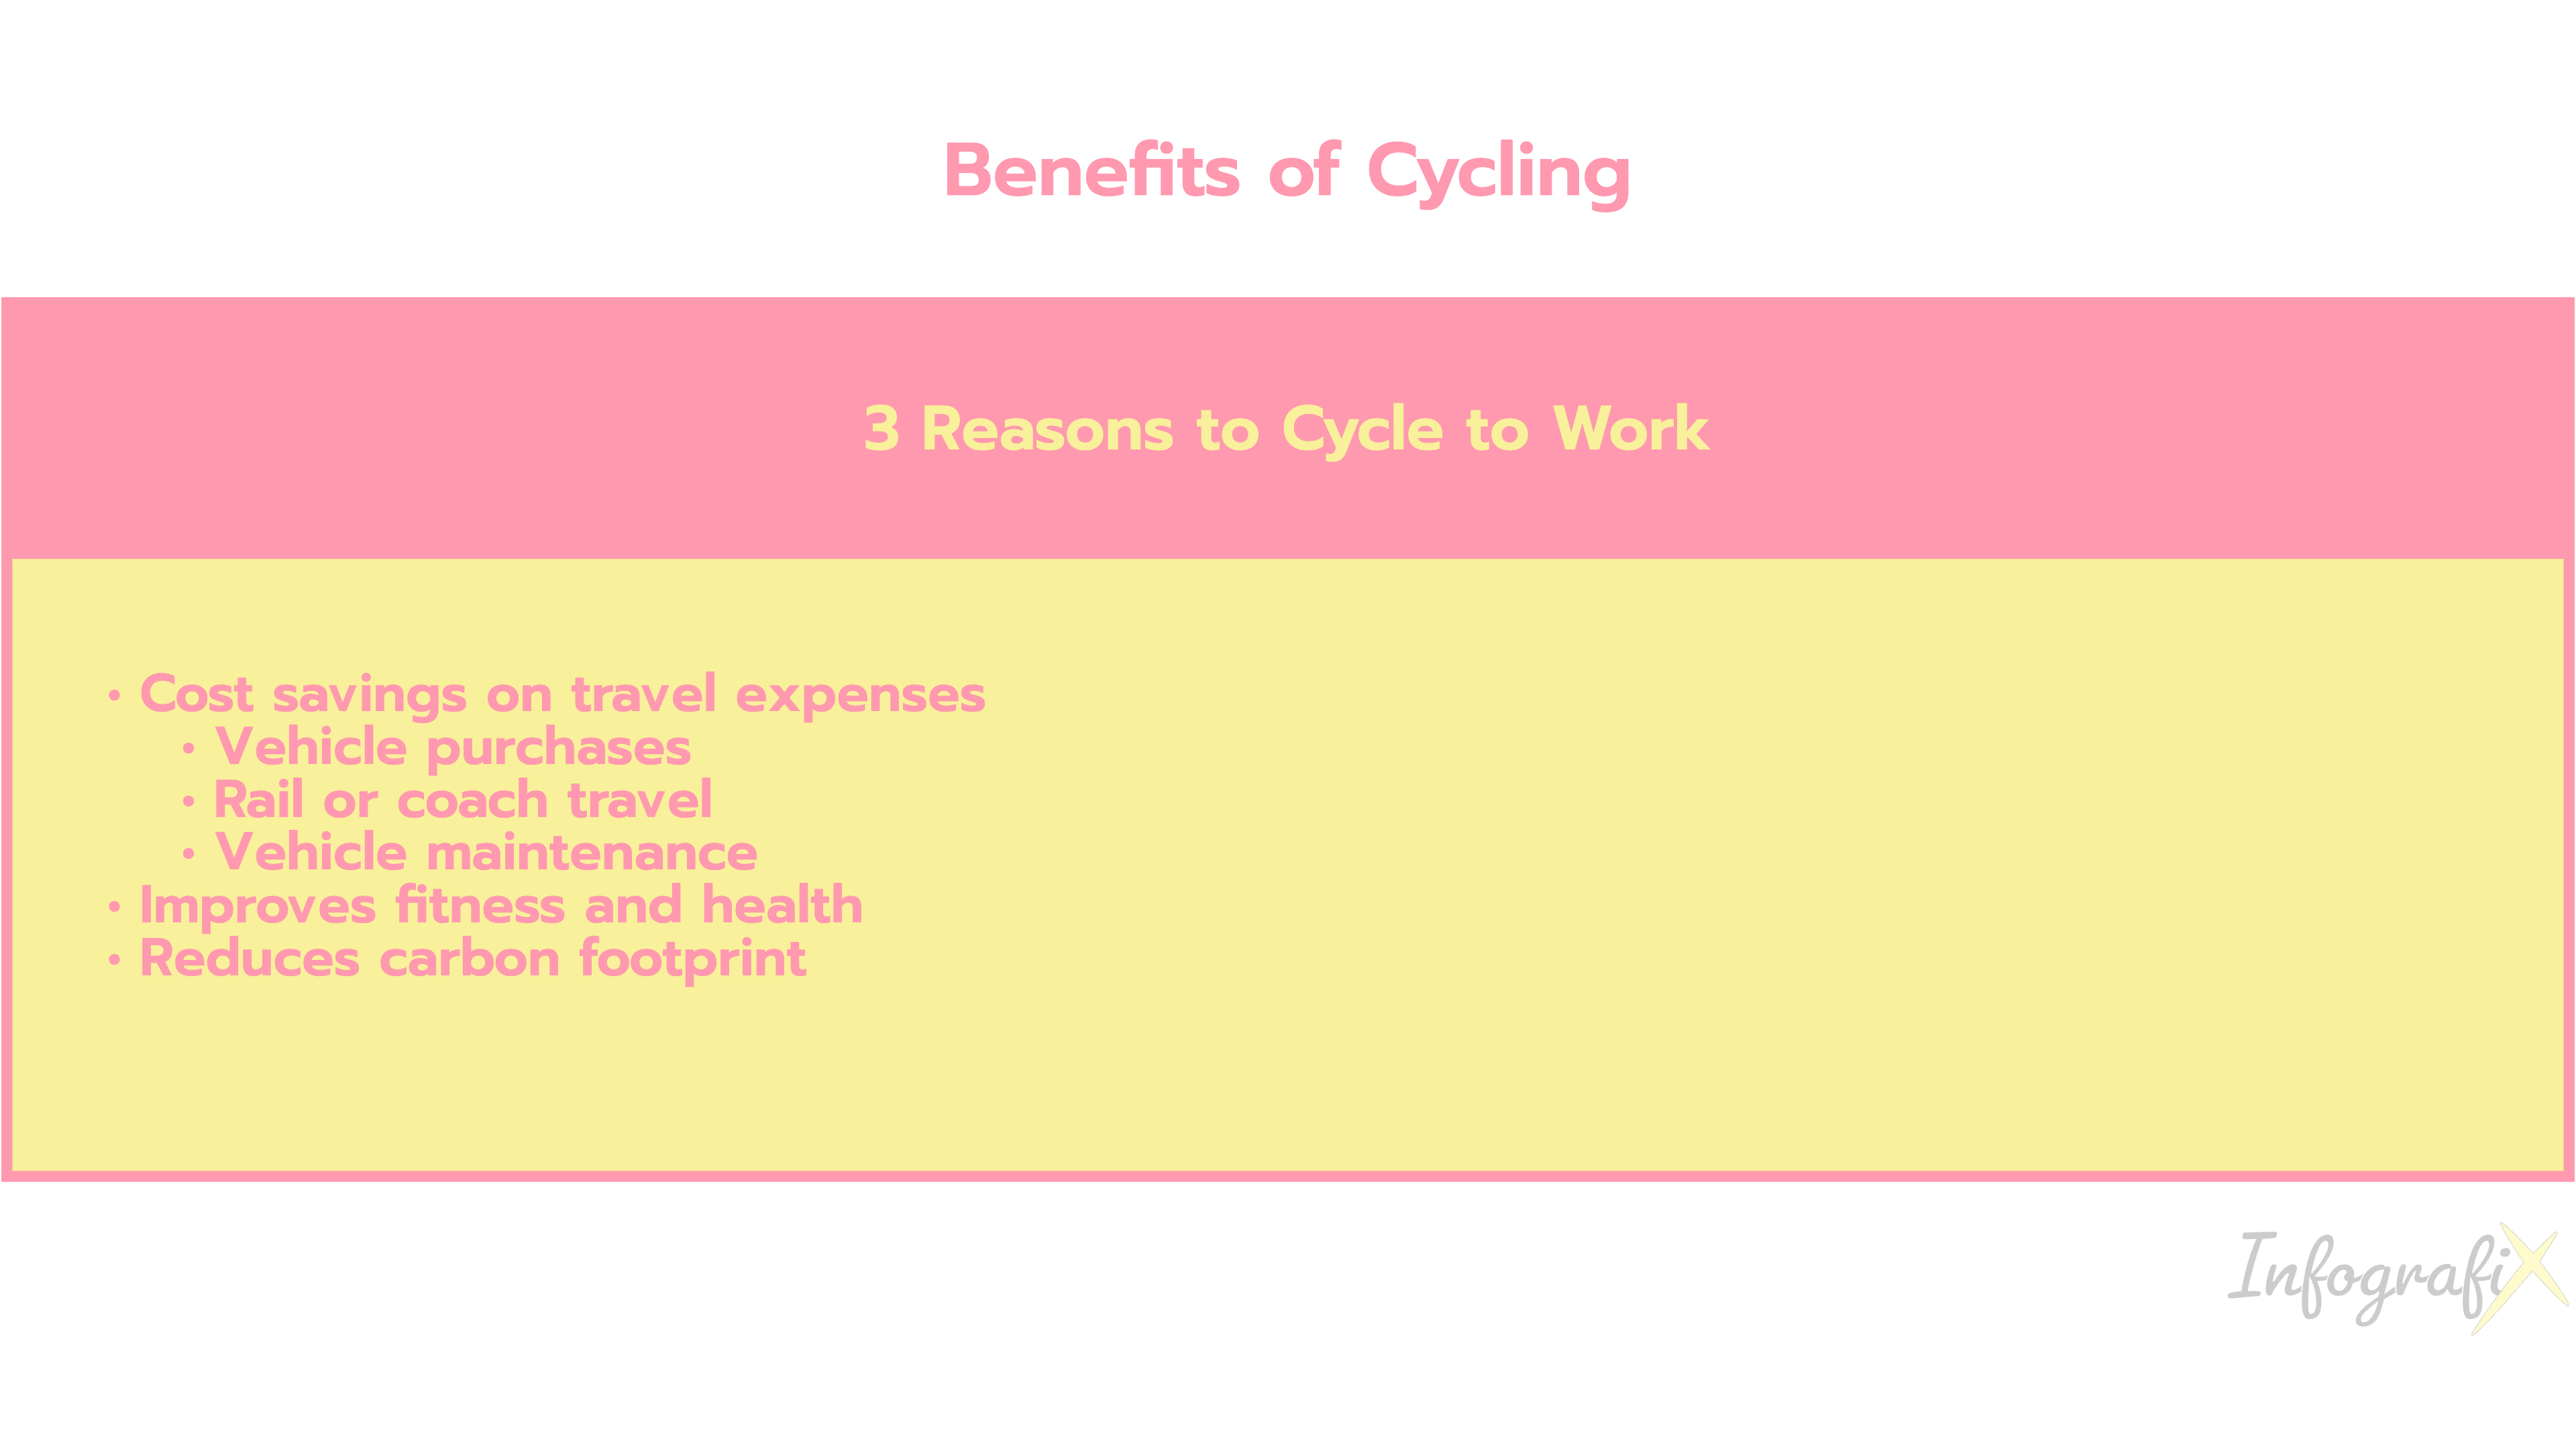
Lists are a versatile and effective tool for organizing information and improving clarity. They can be customized to fit your specific needs and preferences.
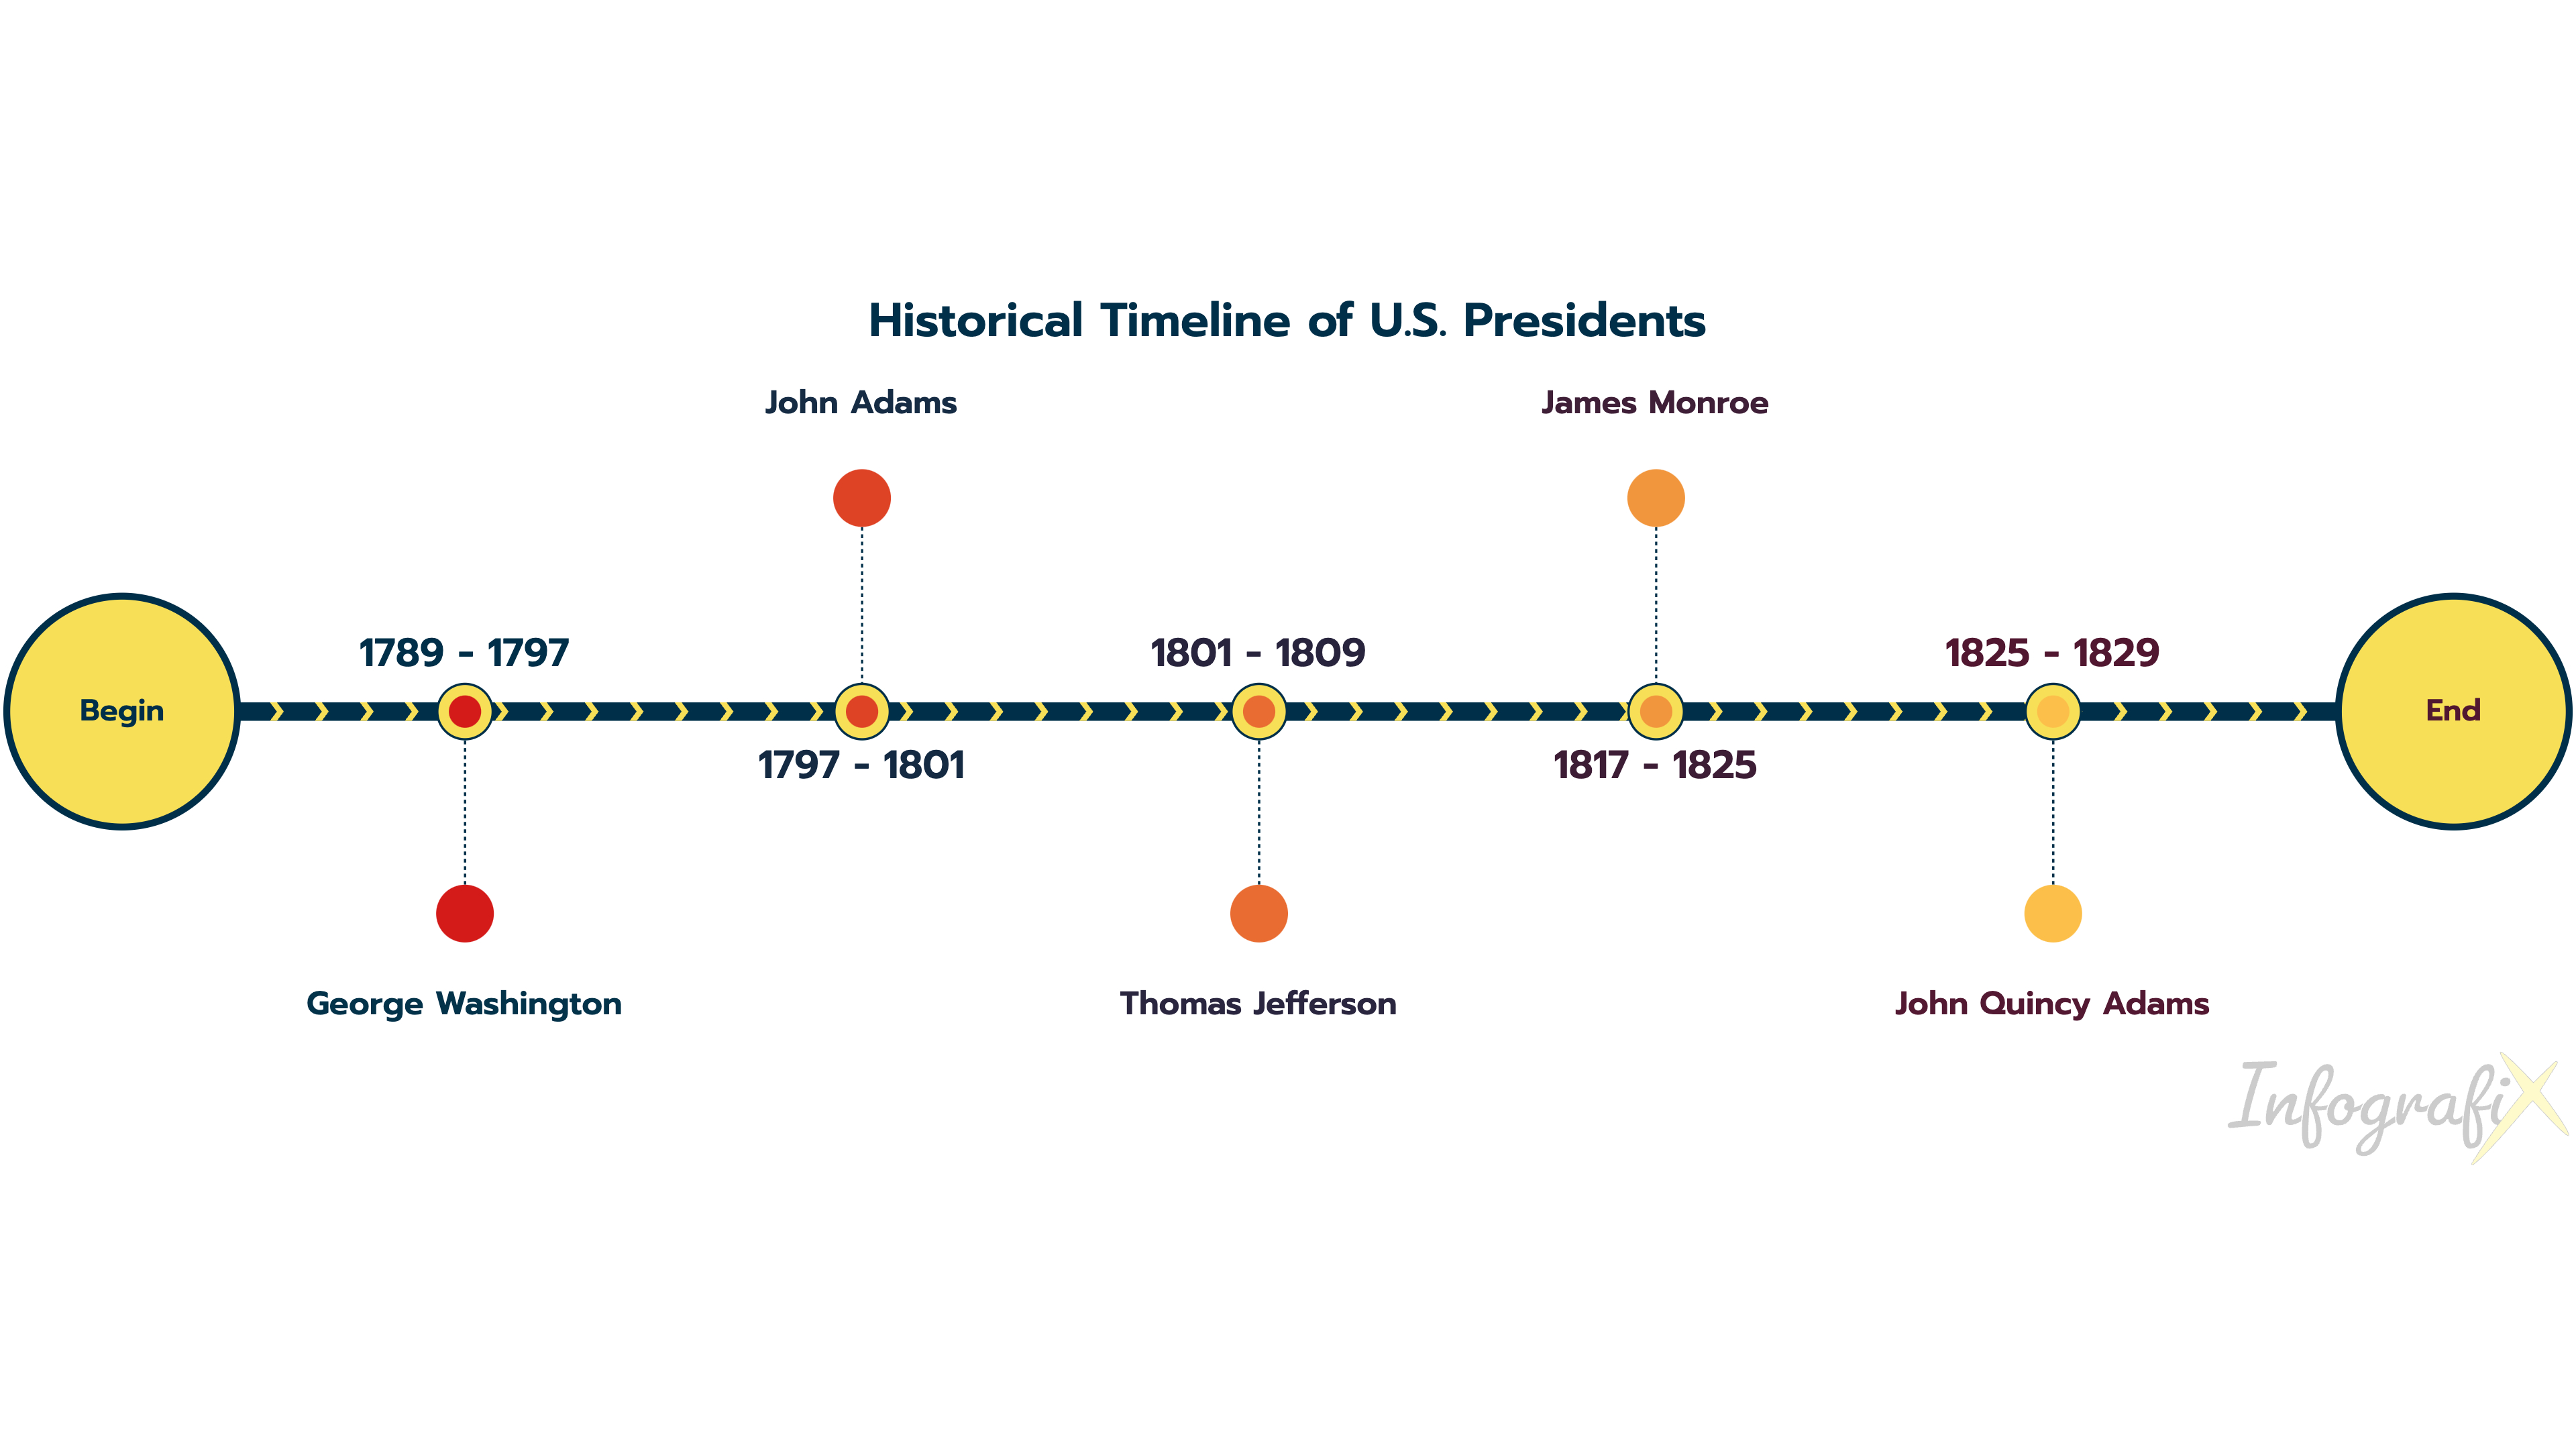
Timelines help us understand the sequence of events and how they connect. A valuable tool for understanding and analyzing information.
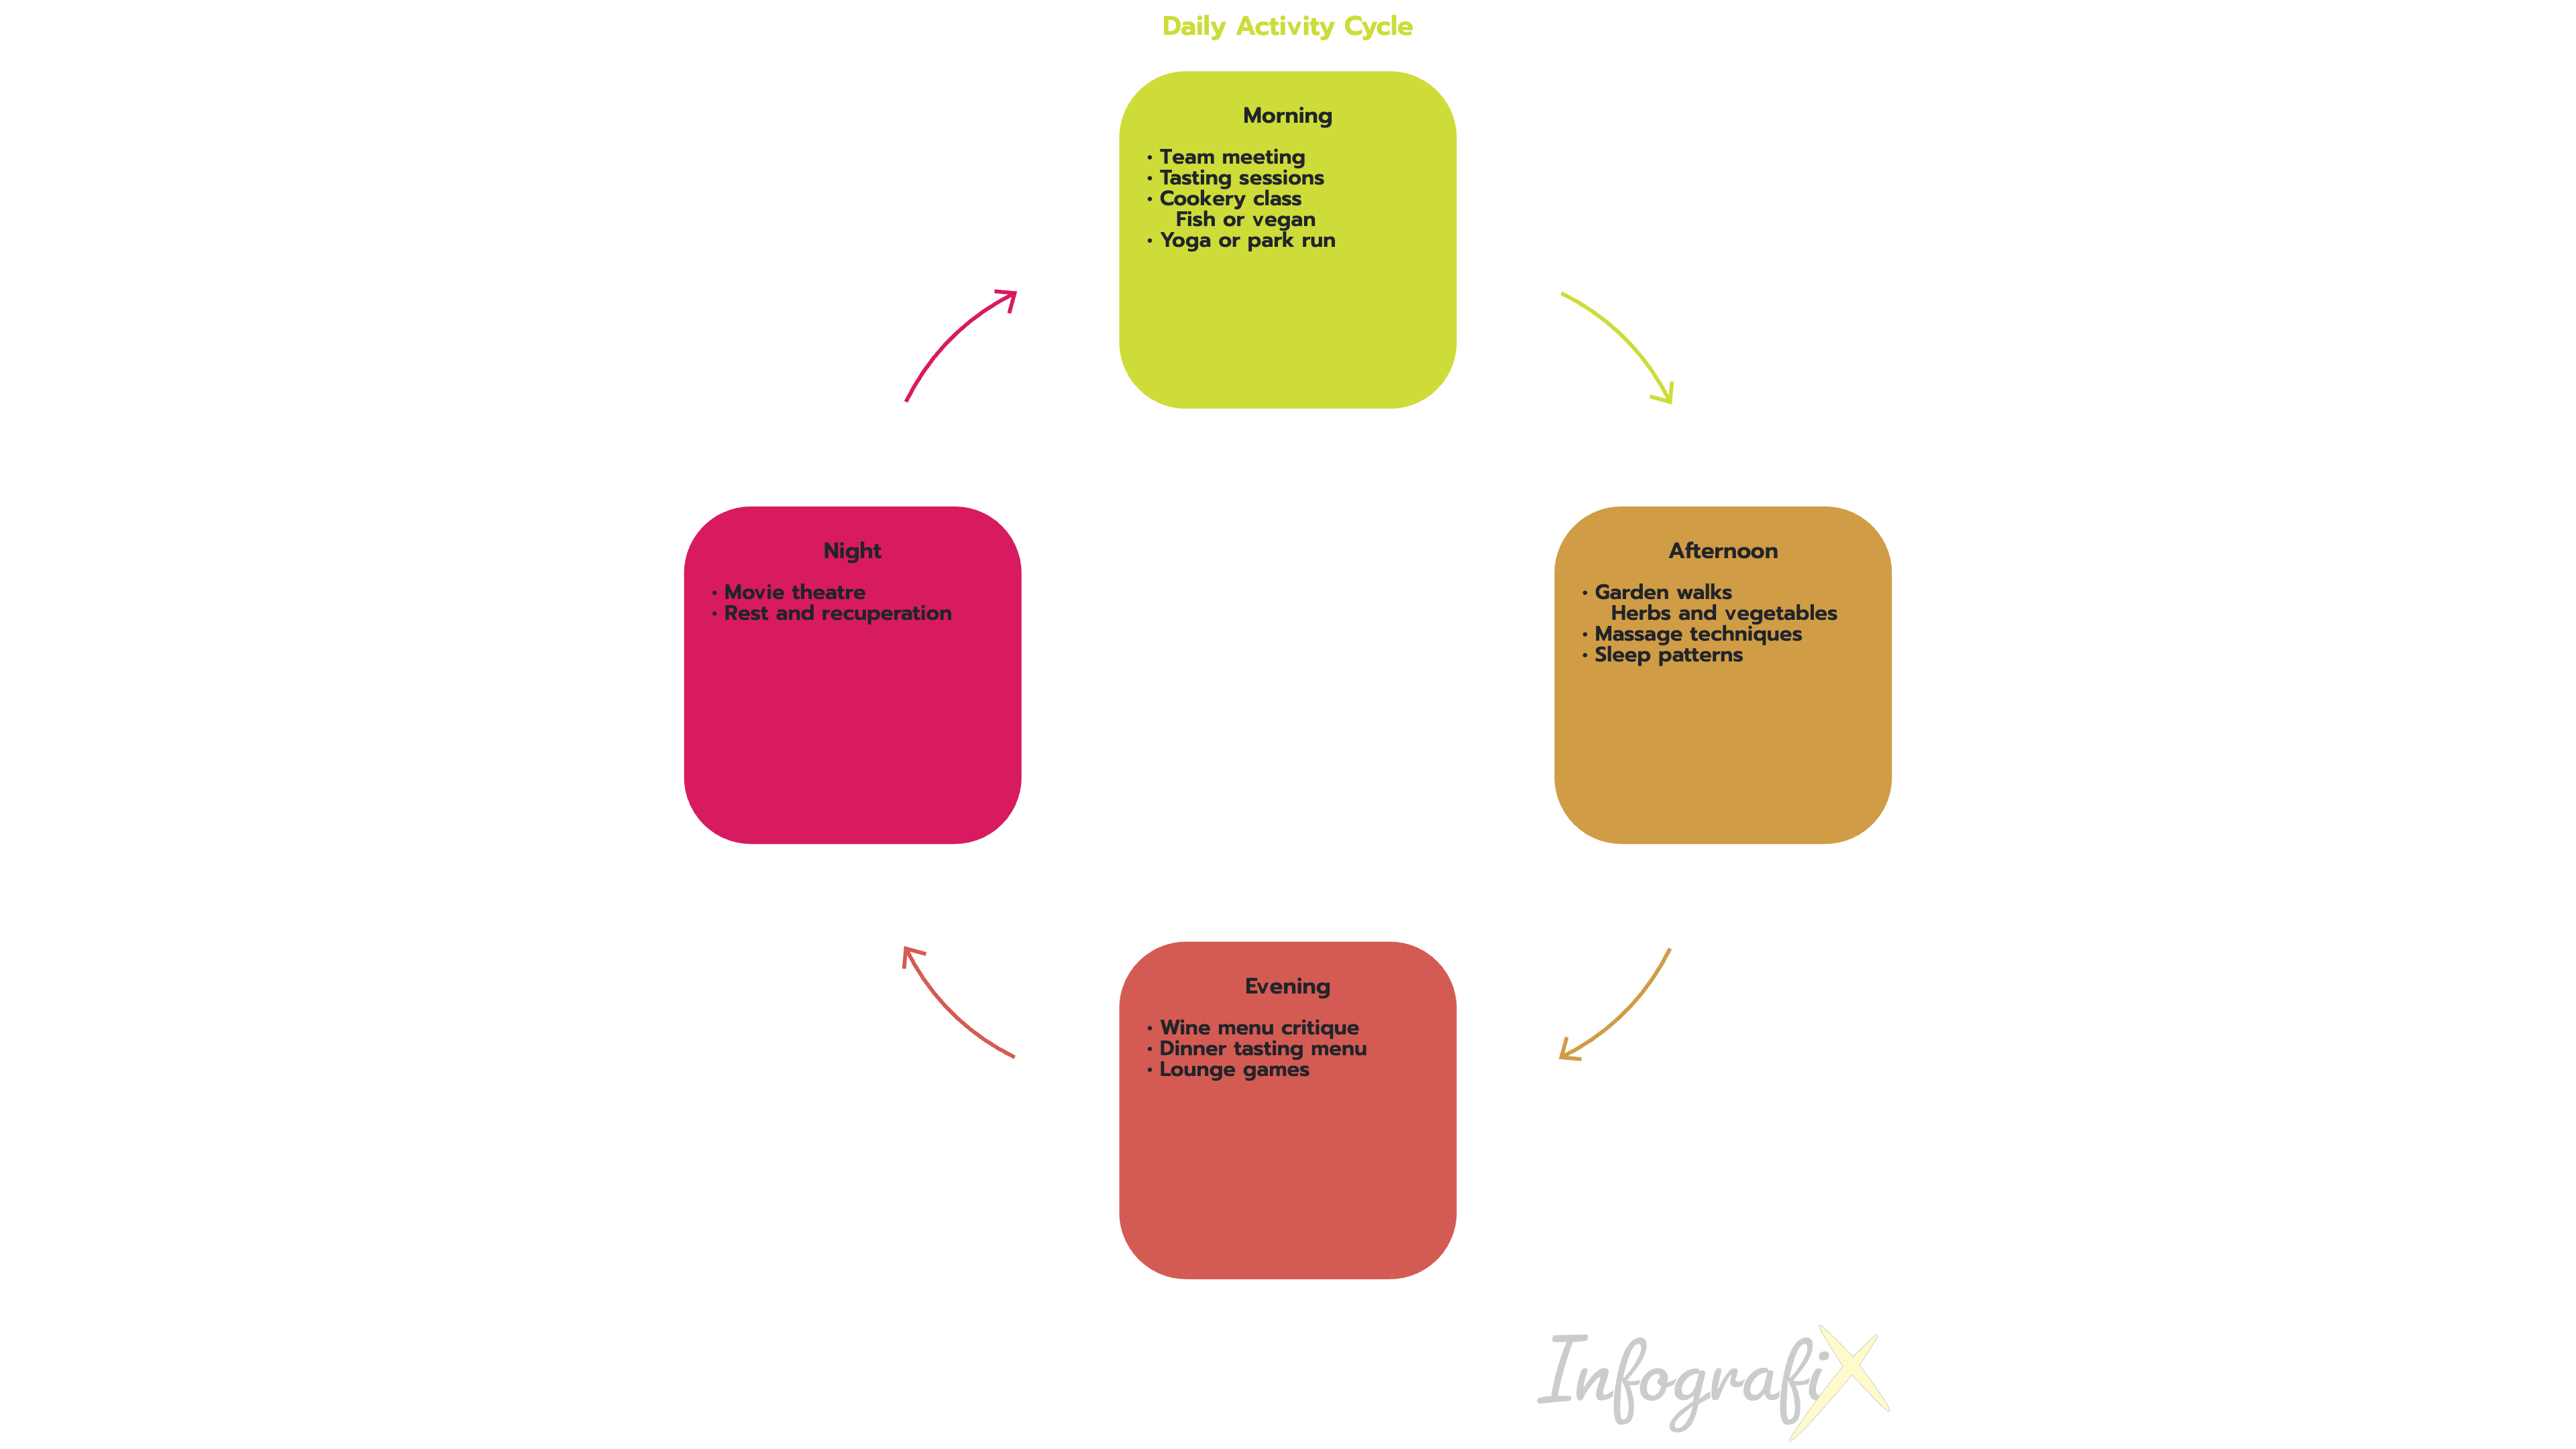
Cycles break down recurring processes and relationships. Cycles are effective tools for communicating complex ideas and processes to others.
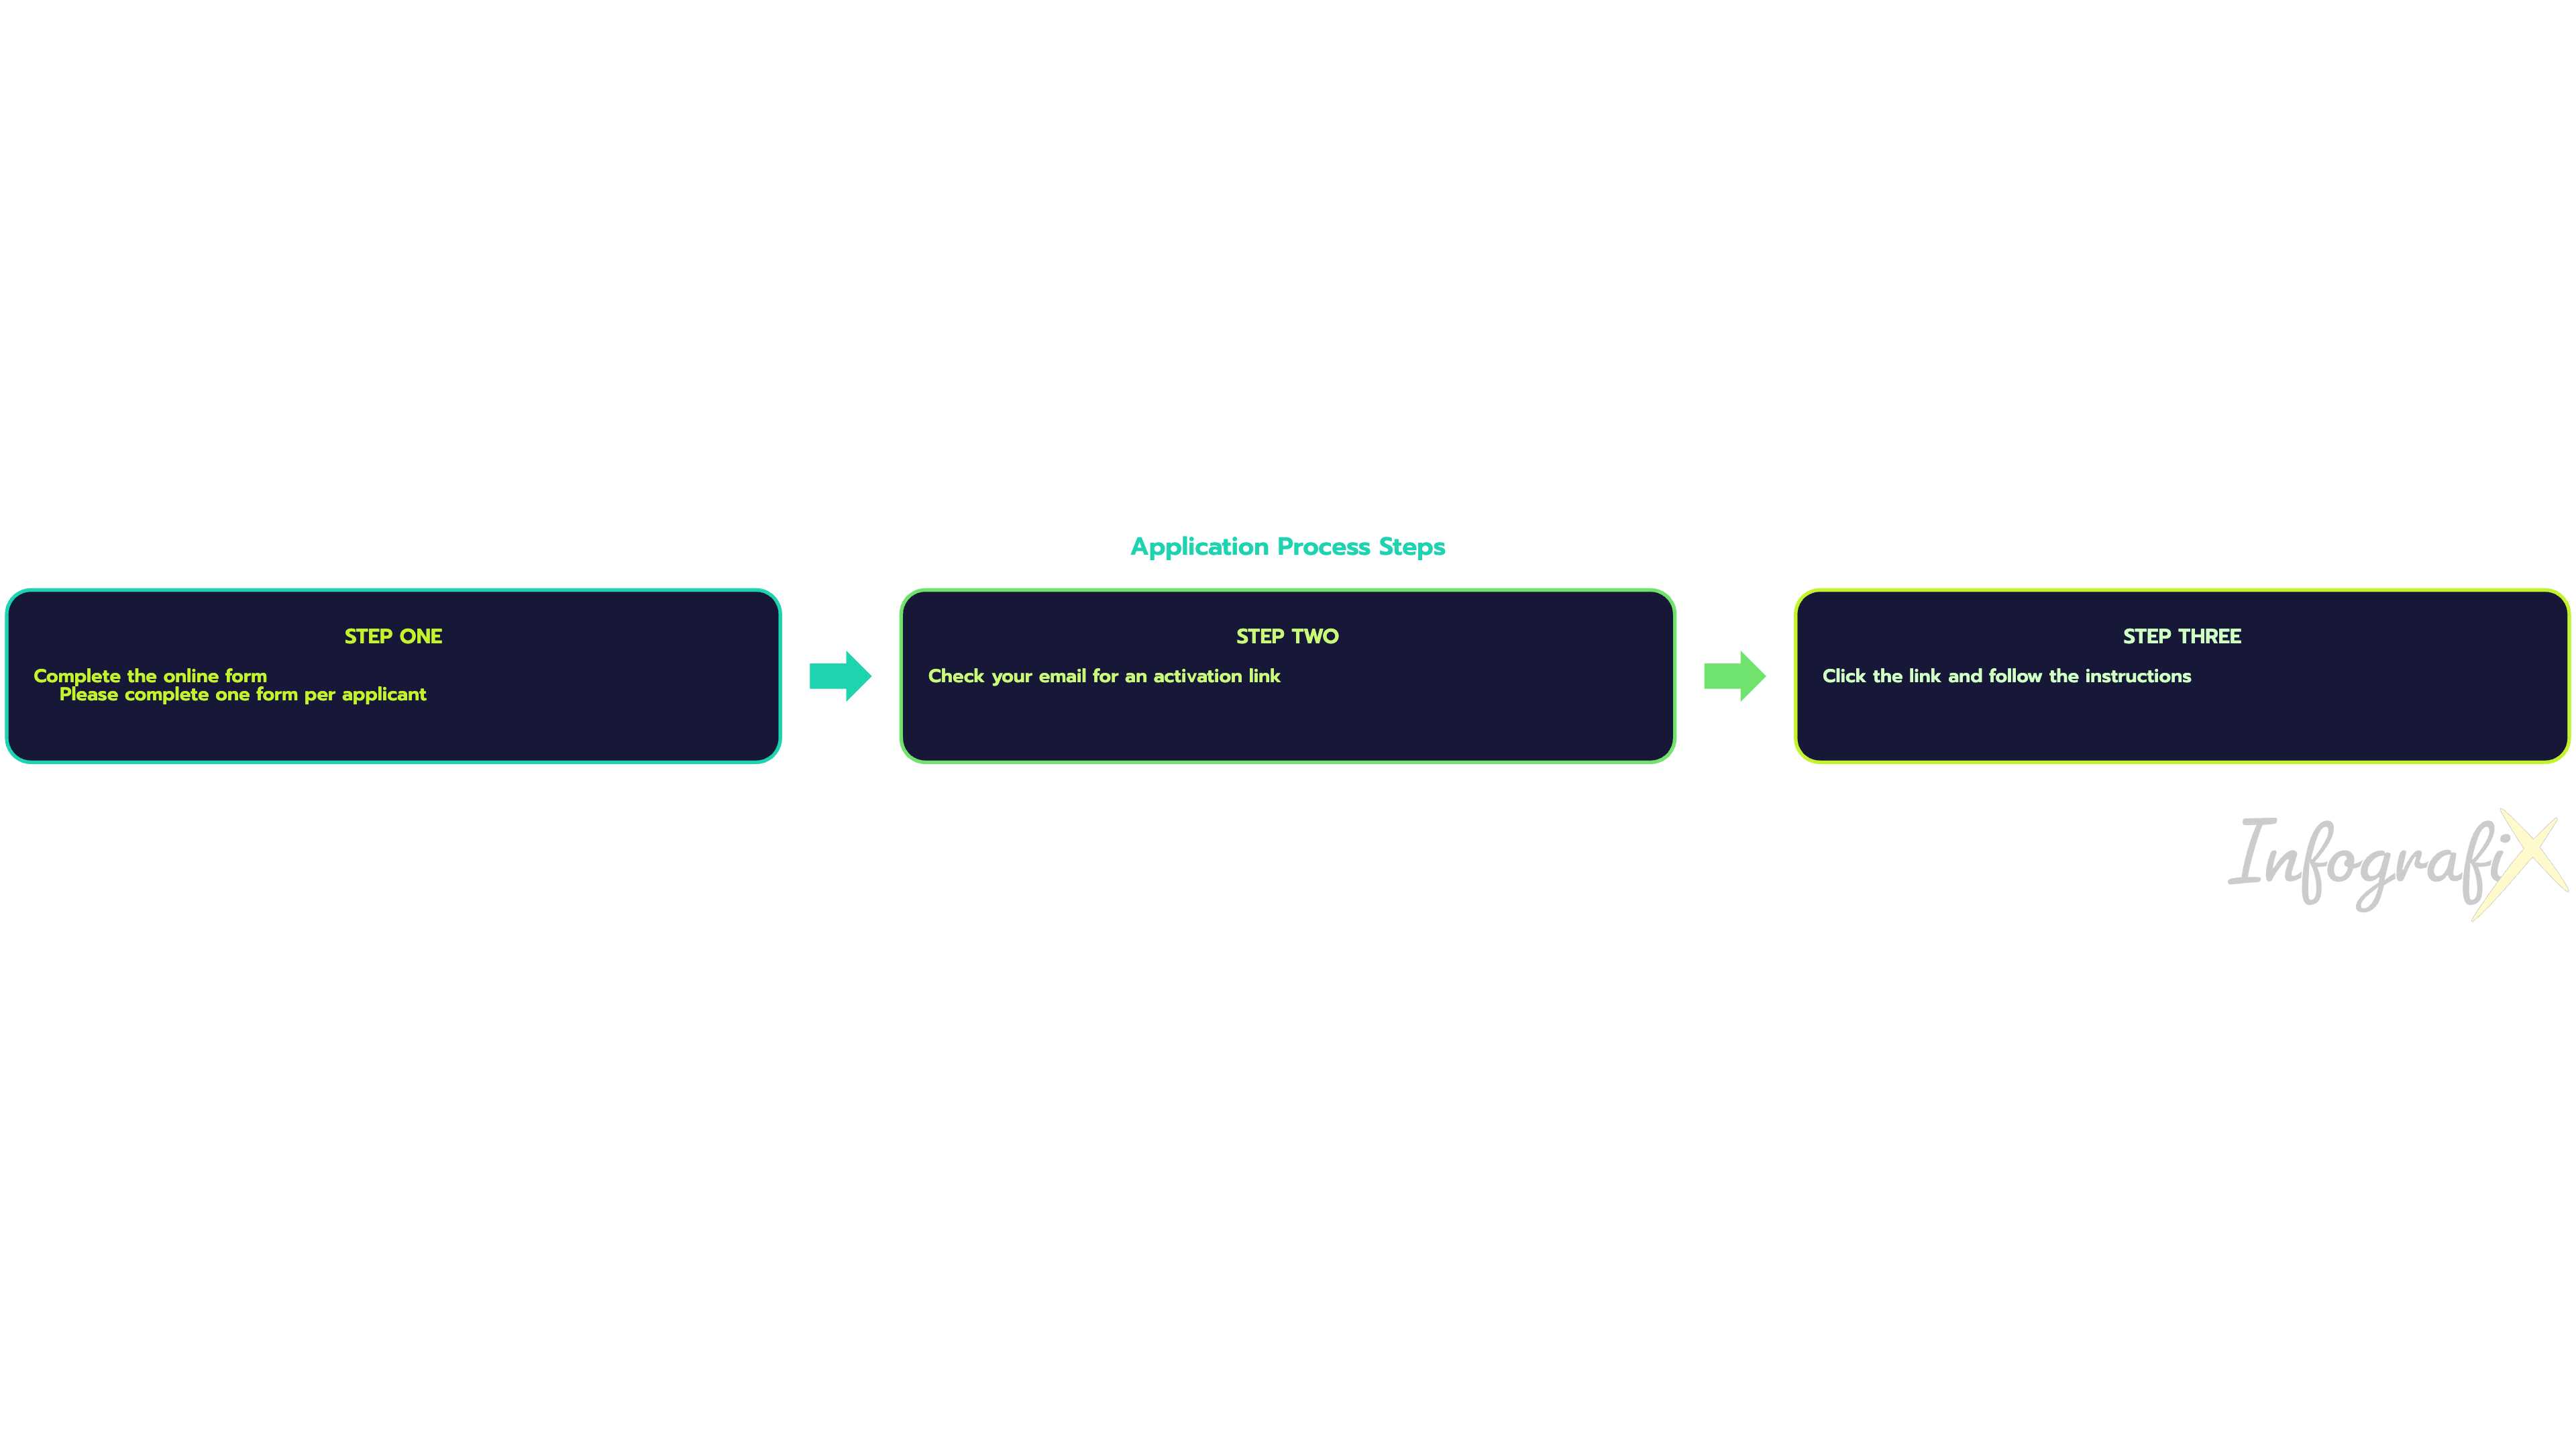
Process Maps help visualize the steps involved in a task or project. Process Maps can assist in making informed decisions about process changes or improvements.
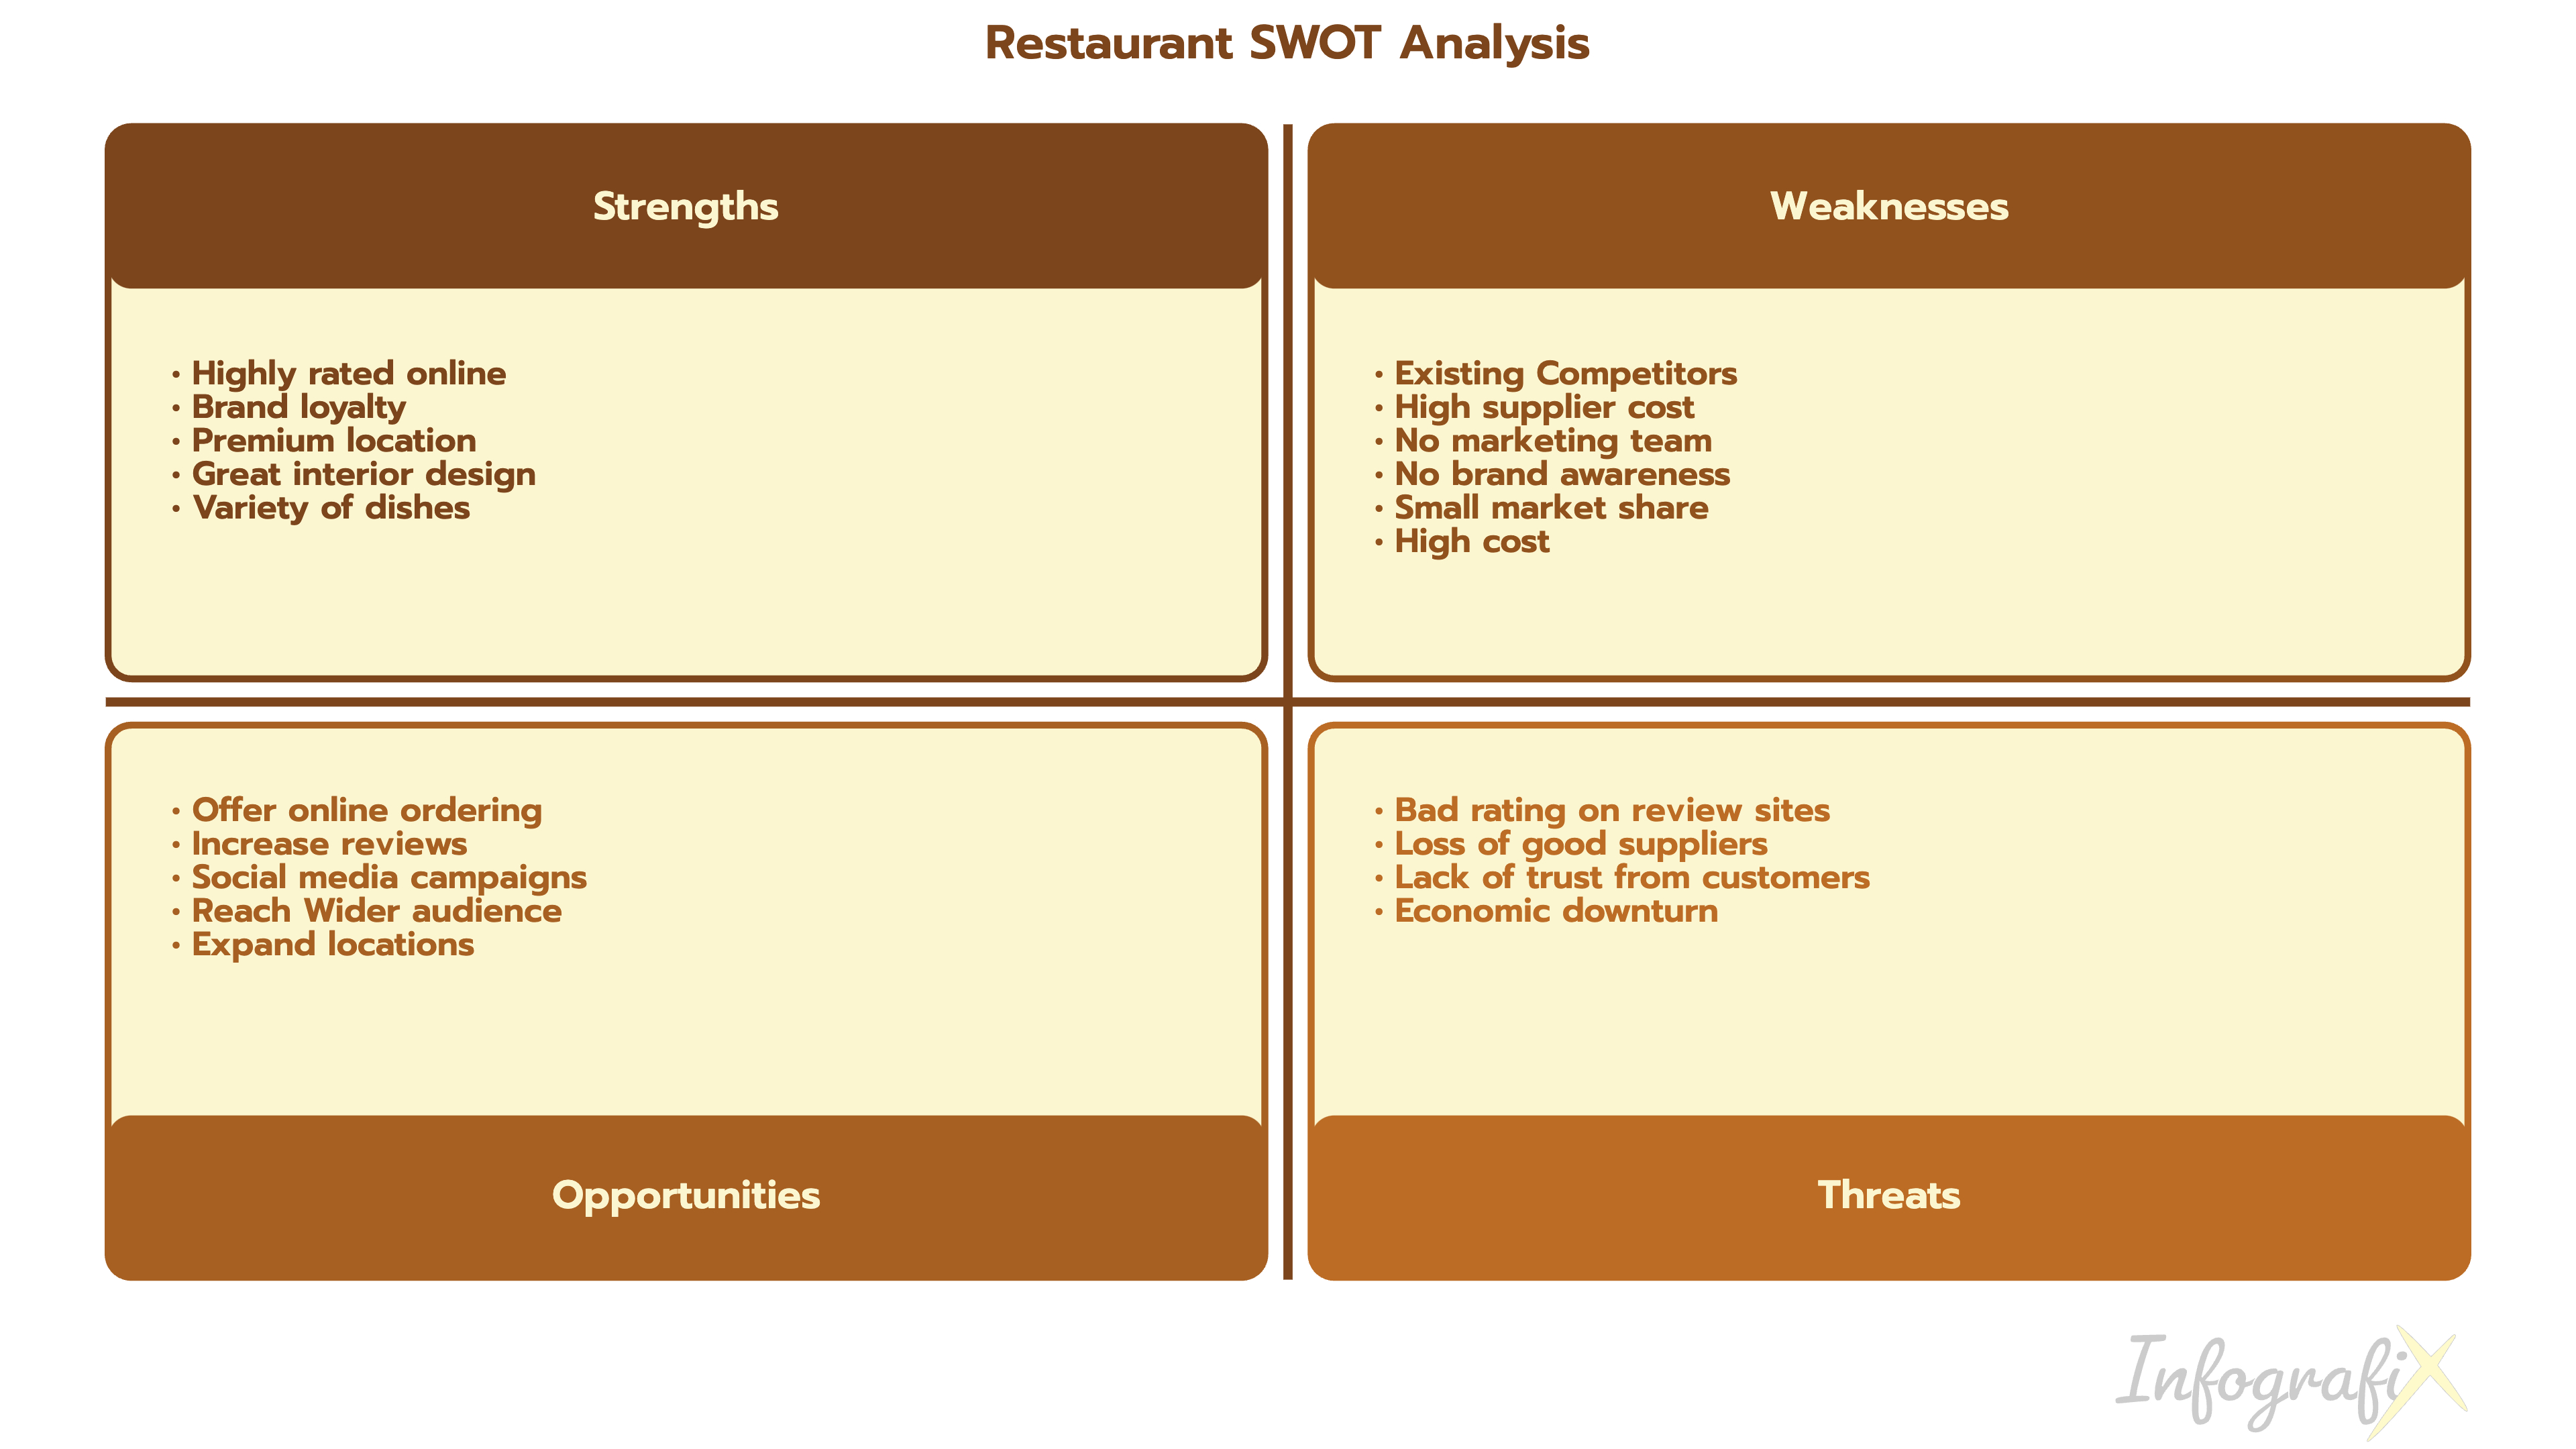
SWOT Analyses are a strategic planning tool that helps individuals or organizations identify their internal strengths and weaknesses, as well as external opportunities and threats.
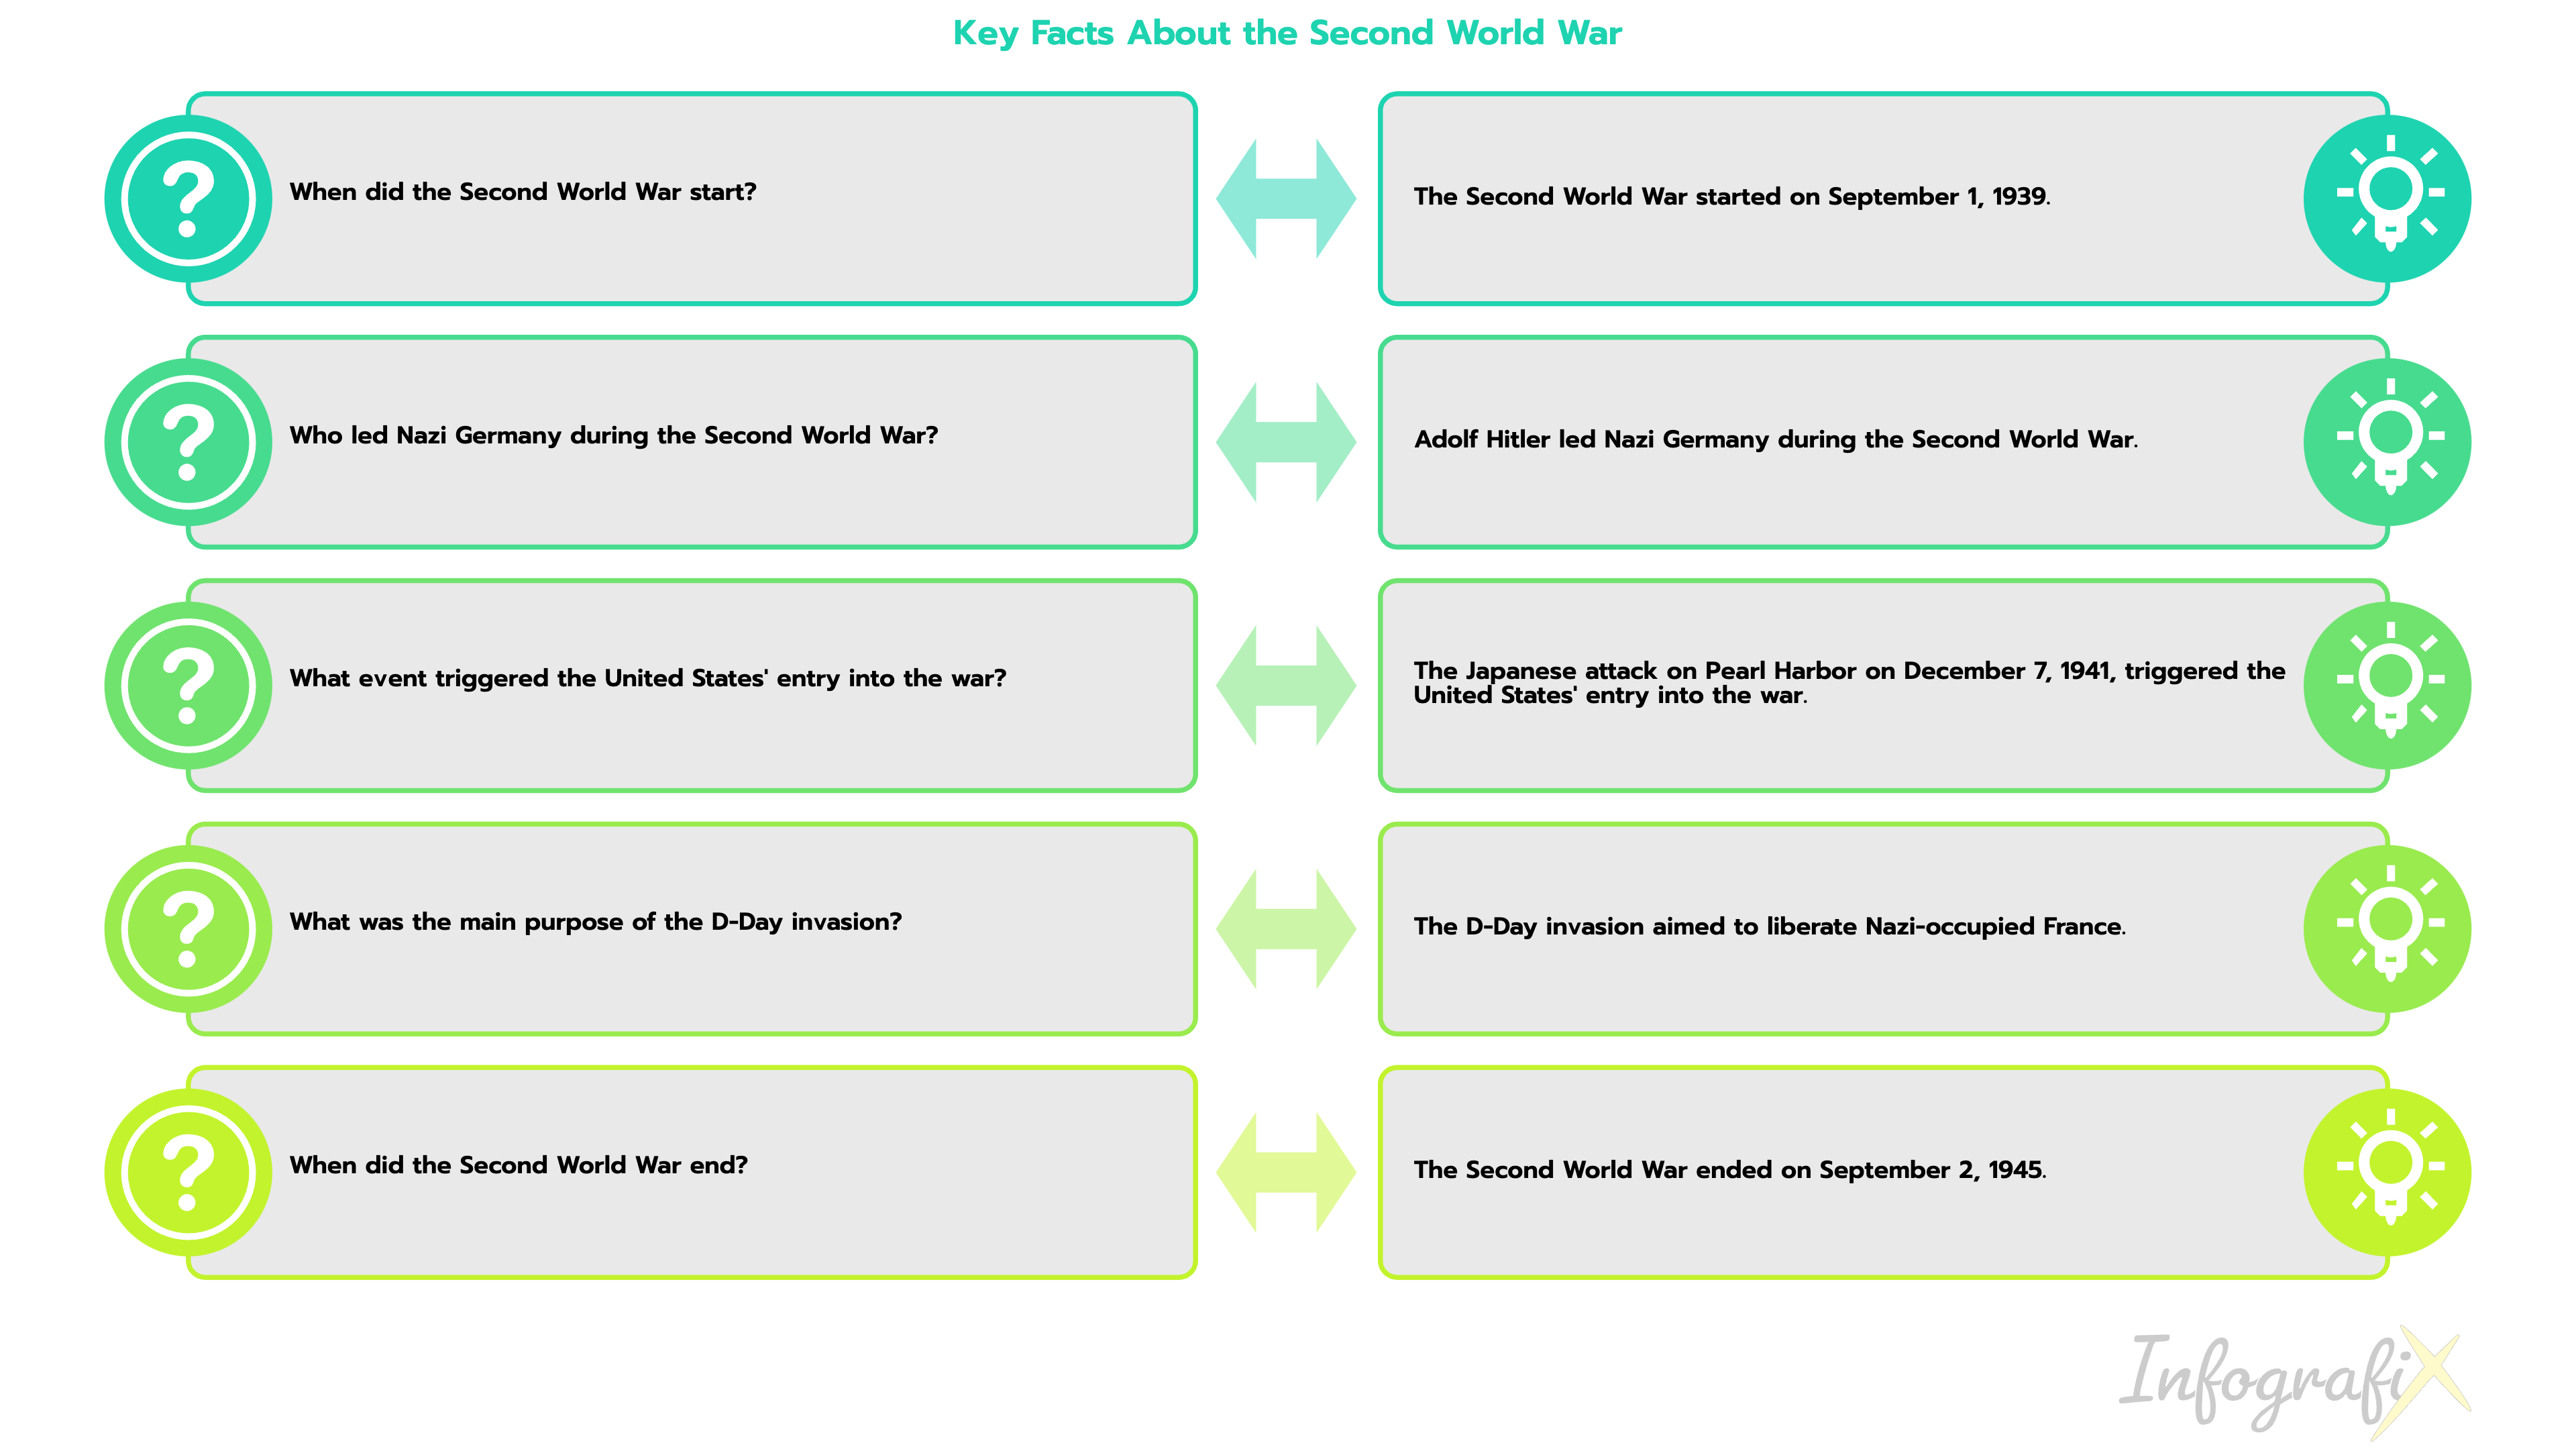
Q&As provide a clear and organized way to present information. Q&As can be used to teach and explain concepts in a clear and engaging way.
Take your infographics to the next level! Infografix is available for free on Apple App Store and Google Play. Our app is gorgeously designed for you to create infographics in the easiest and most relaxing way.
Download it now from your mobile phone or tablet.